Trading Statistics
It is important for a trader to see the full picture of trading: the results of deals, the impact of exchange commissions and the actual changes in the balance. You can keep records in tables, but it is more convenient to use trader’s diaries (connected to the exchange via an API with read-only access) and the built-in Statistics in Veles.
Where to view statistics
Section titled “Where to view statistics”Open the page: https://veles.finance/cabinet/statistics
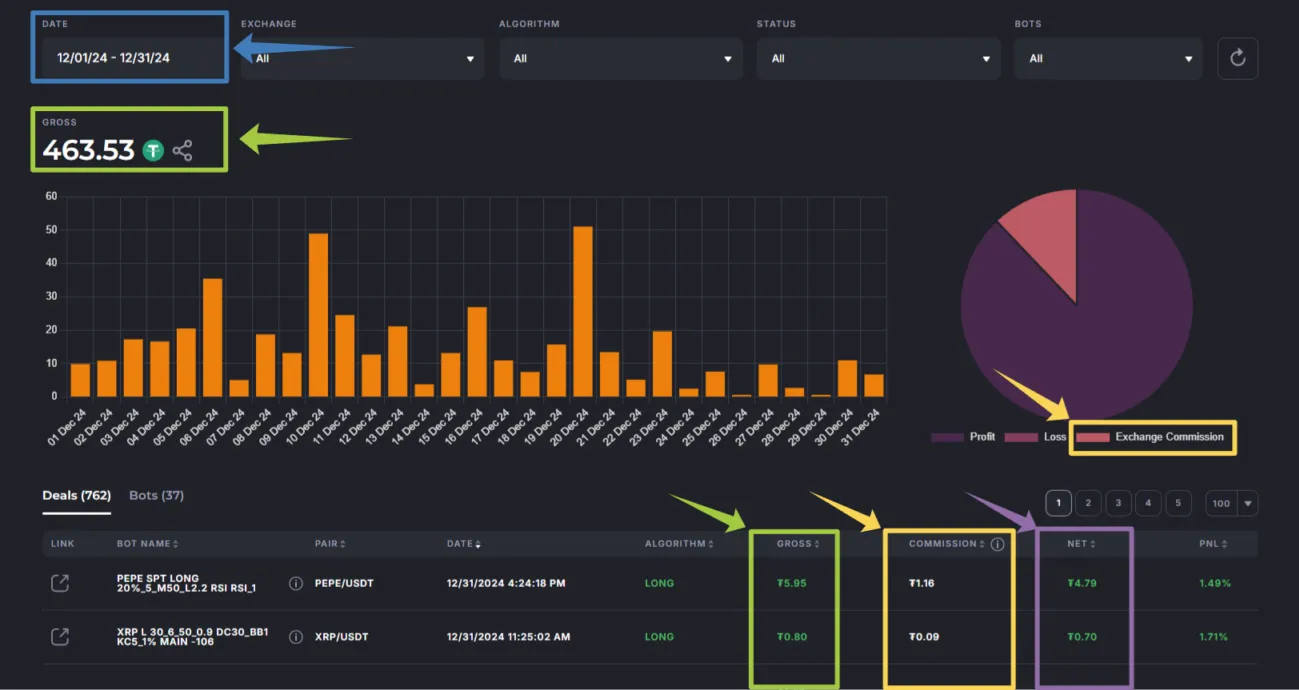
On the page you will see aggregated totals and a currency breakdown. Below see the blocks with key metrics.
Key metrics: Gross, Net, commission, funding
Section titled “Key metrics: Gross, Net, commission, funding”Gross (dirty profit)
Section titled “Gross (dirty profit)”Gross — the difference between opening and closing trade orders. In the interface this amount is given in USDT, even if the actual movements were in a different currency.
- On the right, the total for the last 30 days is shown by default; the dynamics (+/−) by day/week is normal. If necessary, change the date filter.
- Below is the currency layout.
Net (net profit before Funding)
Section titled “Net (net profit before Funding)”Net = Gross − Trading fees of the exchange.
This is a subtotal:
- Spot: Net ≈ is what actually gets into the balance.
- Futures: Net does not take into account Funding fee, so this is not the final result.
Exchange commission (Trading fee)
Section titled “Exchange commission (Trading fee)”In the “Commission” column the trading fee is summed up for all the orders of the deal. In the table, the commission is given in USDT at the exchange rate at the time of closing the deal.
- If the commission on the exchange is written off in a third currency (for example, BNB), there may be a dash in this table row, although the commission was actually written off.
- If the commission is < 0.01 USDT, there may also be dashes in the rows, but in the total amount these values are summed up and taken into account.
For more information about rates, see the section Exchange fees.
Funding fee
Section titled “Funding fee”Relevant only for futures. The final result on the exchange is calculated as Net − Funding fee. Currently, Veles does not receive detailed funding amounts from exchanges — therefore funding is not displayed on the Statistics page. For the final figures, use the Trading history on the exchange.
What gets into the “Statistics” and what doesn’t
Section titled “What gets into the “Statistics” and what doesn’t”- Included: trades closed by the bot via Take Profit/Stop Loss.
- Not included: deals that were interrupted with errors/liquidation or closed manually. There may be no totals for them. Check the Trading history on the exchange.
Date filters: two independent areas
Section titled “Date filters: two independent areas”There are two filter blocks on the page (blue frames on the screenshot) — left and right. They are independent from each other, so the displayed amounts may vary. Slight discrepancies are possible due to rounding.
PnL in Veles and on the exchange — why are they different
Section titled “PnL in Veles and on the exchange — why are they different”- PnL in Veles — net price move (percentage of the average position price without leverage).
- PnL on the exchange — PnL on a leveraged position.
Example: 1% PnL in Veles ≈ 10% PnL on the exchange at x10 leverage. Also note, that the results sharing pictures indicate ROI (Return on Investment): ROI = PnL / initial margin.
Where to view the final results (especially for futures)
Section titled “Where to view the final results (especially for futures)”- On the exchange, open Trading History → Closed P&L by positions (not by orders). These are the final results taking Funding fee into account.
- Do not focus on the “floating” PnL chart in the exchange’s terminal — it shows Unrealized P&L for all open positions; in the process, it is usually “red”, and this is not a sign of error.
Trader’s diaries: when are they useful
Section titled “Trader’s diaries: when are they useful”Connect an external trader’s diary (TradersDiaries, TabTrader, TraderMakeMoney, etc.). These applications pull data from the exchange and provide in-depth analytics (please note that each service has its own limitations).
Summary
Section titled “Summary”- Gross is the base for the Veles commission (20% of the Gross profit of a profitable deal).
- Net = Gross − Trading fee: on the spot it is close to the fact, on futures it is not final.
- Futures: Total = Net − Funding fee → look at Trading history on the exchange.
- The “Statistics” section in Veles is an operational control tool; we go to the exchange for the final figures on futures.
Find out about commissions: Exchange fees.