Relative Strength Index (RSI)
The RSI (Relative Strength Index) is one of the most popular oscillators in technical analysis, measuring the speed and magnitude of price changes. This indicator helps determine whether an asset is overbought or oversold, as well as assess the strength of the current trend.
Calculation Parameters
Section titled “Calculation Parameters”The Veles platform uses a standard period length of 14 for the RSI. Length (period) is the number of candles taken into account in the indicator’s calculations.
You can set your own parameters, for example:
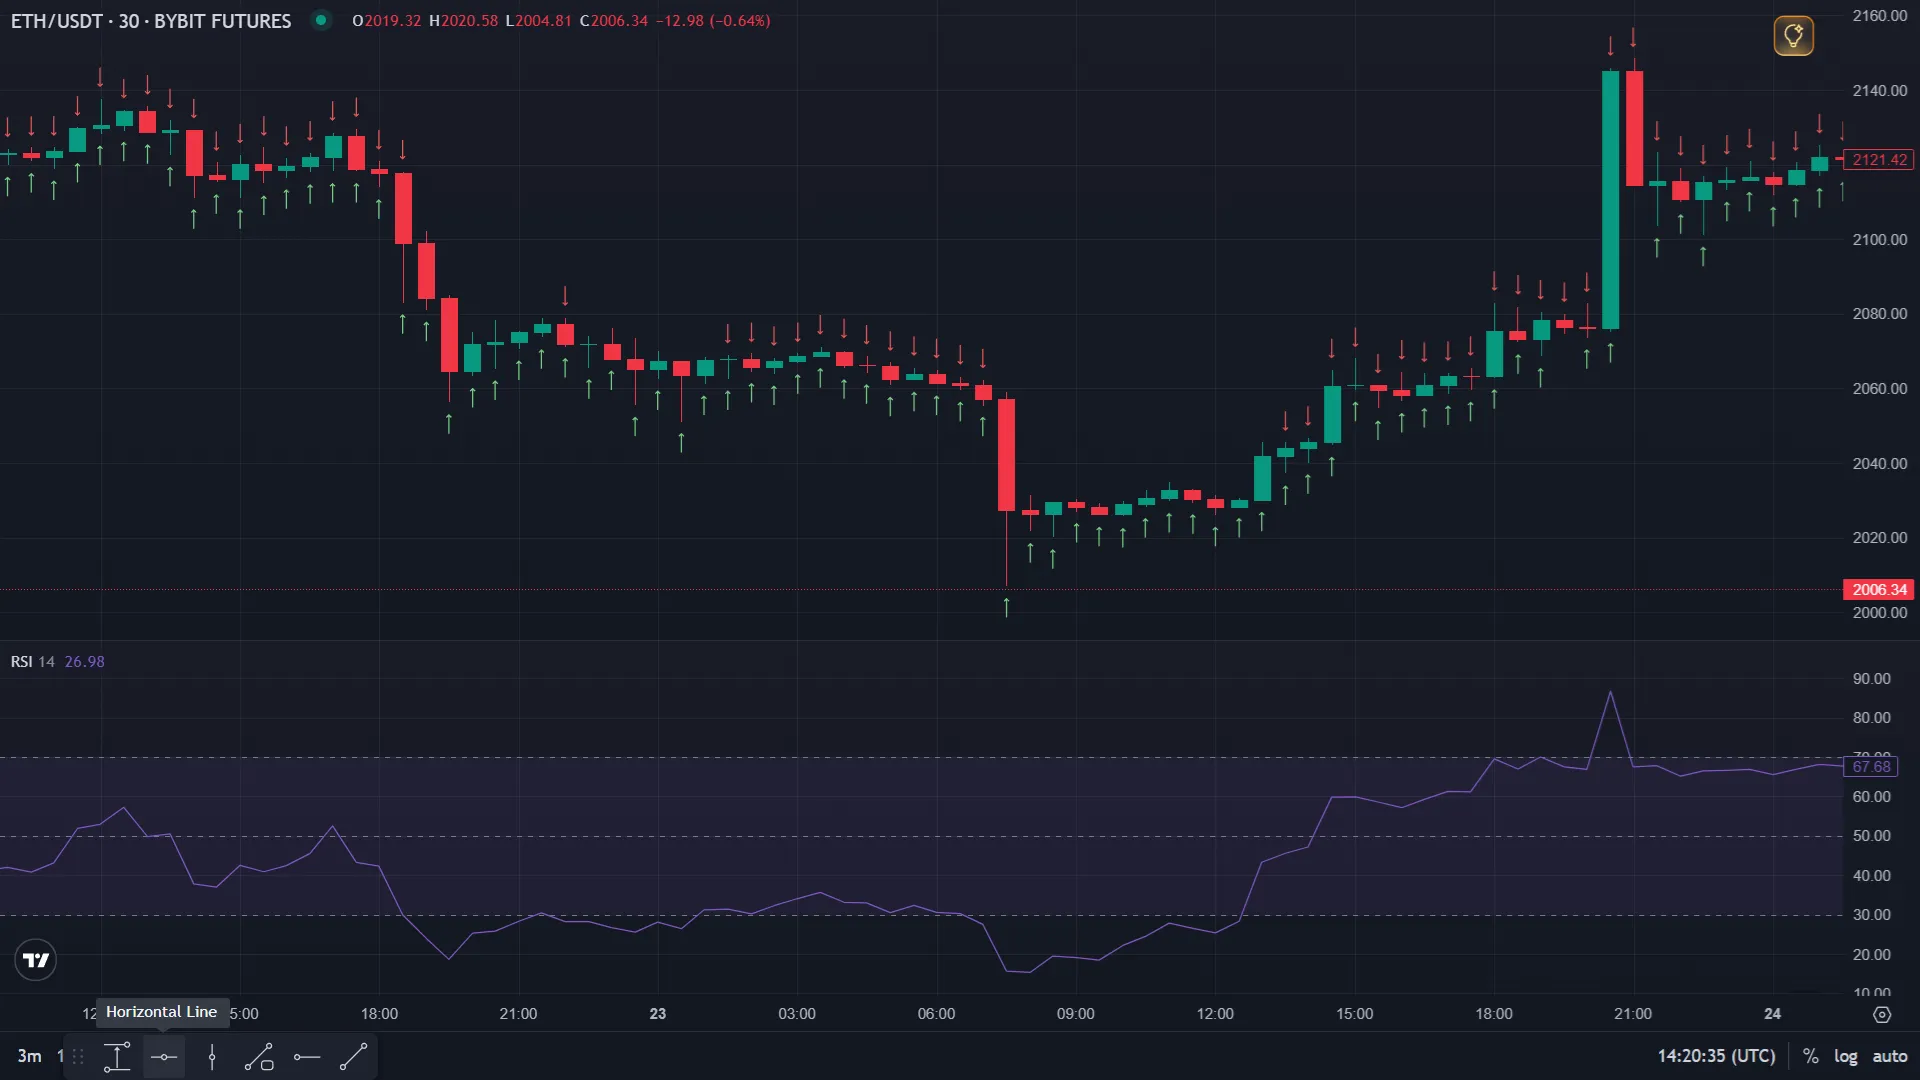
- RSI 30 min < 25 — the asset is heavily oversold, a rise is possible
- RSI 30 min > 80 — the asset is overbought, a downward correction is possible
To change the parameters, click the “Pencil” button in the indicator settings.
Using in Veles Bots
Section titled “Using in Veles Bots”When no value specified:
- For a long bot: entry when RSI < 70, exit when RSI > 30
- For a short bot: entry when RSI > 30, exit when RSI < 70
Use the “Pencil” button to set the different, desired parameters.
RSI Levels
Section titled “RSI Levels”Standard Boundaries:
- Above 70 → asset is overbought (possible downward correction, open a Short deal)
- Below 30 → asset is oversold (possible upward correction, open a Long deal)
⚠ However, the asset may remain outside these levels for an extended period, continuing to rise or fall. Therefore, it is important to wait for confirmation of a reversal.
”RSI Levels” Filters on the Platform
Section titled “”RSI Levels” Filters on the Platform”Veles also provides indicators that signal a trend change when levels 30 or 70 are crossed:
- Crossing 70 from top to bottom → a strong signal to open a Short deal or close a Long deal
- Crossing 30 from bottom to top → a strong signal to open a Long deal or close a Short deal
These signals appear rarely, but are considered among the most reliable in RSI analysis.
Limitations
Section titled “Limitations”- RSI can remain in overbought or oversold territory for extended periods during strong trends, generating premature reversal signals.
- On very short timeframes, RSI produces significant noise and requires additional filters.
- The standard 14-period setting may need adjustment for highly volatile crypto assets.
Using in Veles Bots (Flexible Indicator)
Section titled “Using in Veles Bots (Flexible Indicator)”- Period - the number of candles for calculation. Range: 2–100, default 14.
- Interval - the candle timeframe.
- Method - the calculation type. By bar close (only on the selected interval) or by minute (once per minute for any interval).
- Shift - shifts the requested indicator value back by the specified number of candles.
Summary
Section titled “Summary”RSI is one of the most reliable and widely used oscillators in crypto trading. In Veles bots, its overbought/oversold zones and level crossover signals provide clean entry and exit conditions — most effective when combined with trend filters like EMA or ADX to avoid entries against the prevailing direction.