Money Flow Index (MFI)
The Money Flow Index (MFI) is an oscillator that analyzes price and trading volume to assess the inflow and outflow of capital into an asset. Unlike the RSI, the MFI takes into account not only price changes but also trading volume, making it more sensitive to market activity.
How the MFI Works
Section titled “How the MFI Works”For each period, a typical price (the average of the high, low, and close) is calculated. Comparing the current and previous typical prices determines the direction of the money flow:
- Positive flow — if the price is higher than the previous one.
- Negative flow — if the price is lower than the previous one.
Based on this data, the ratio of positive to negative flows is calculated and an MFI line is plotted in the range from 0 to 100.
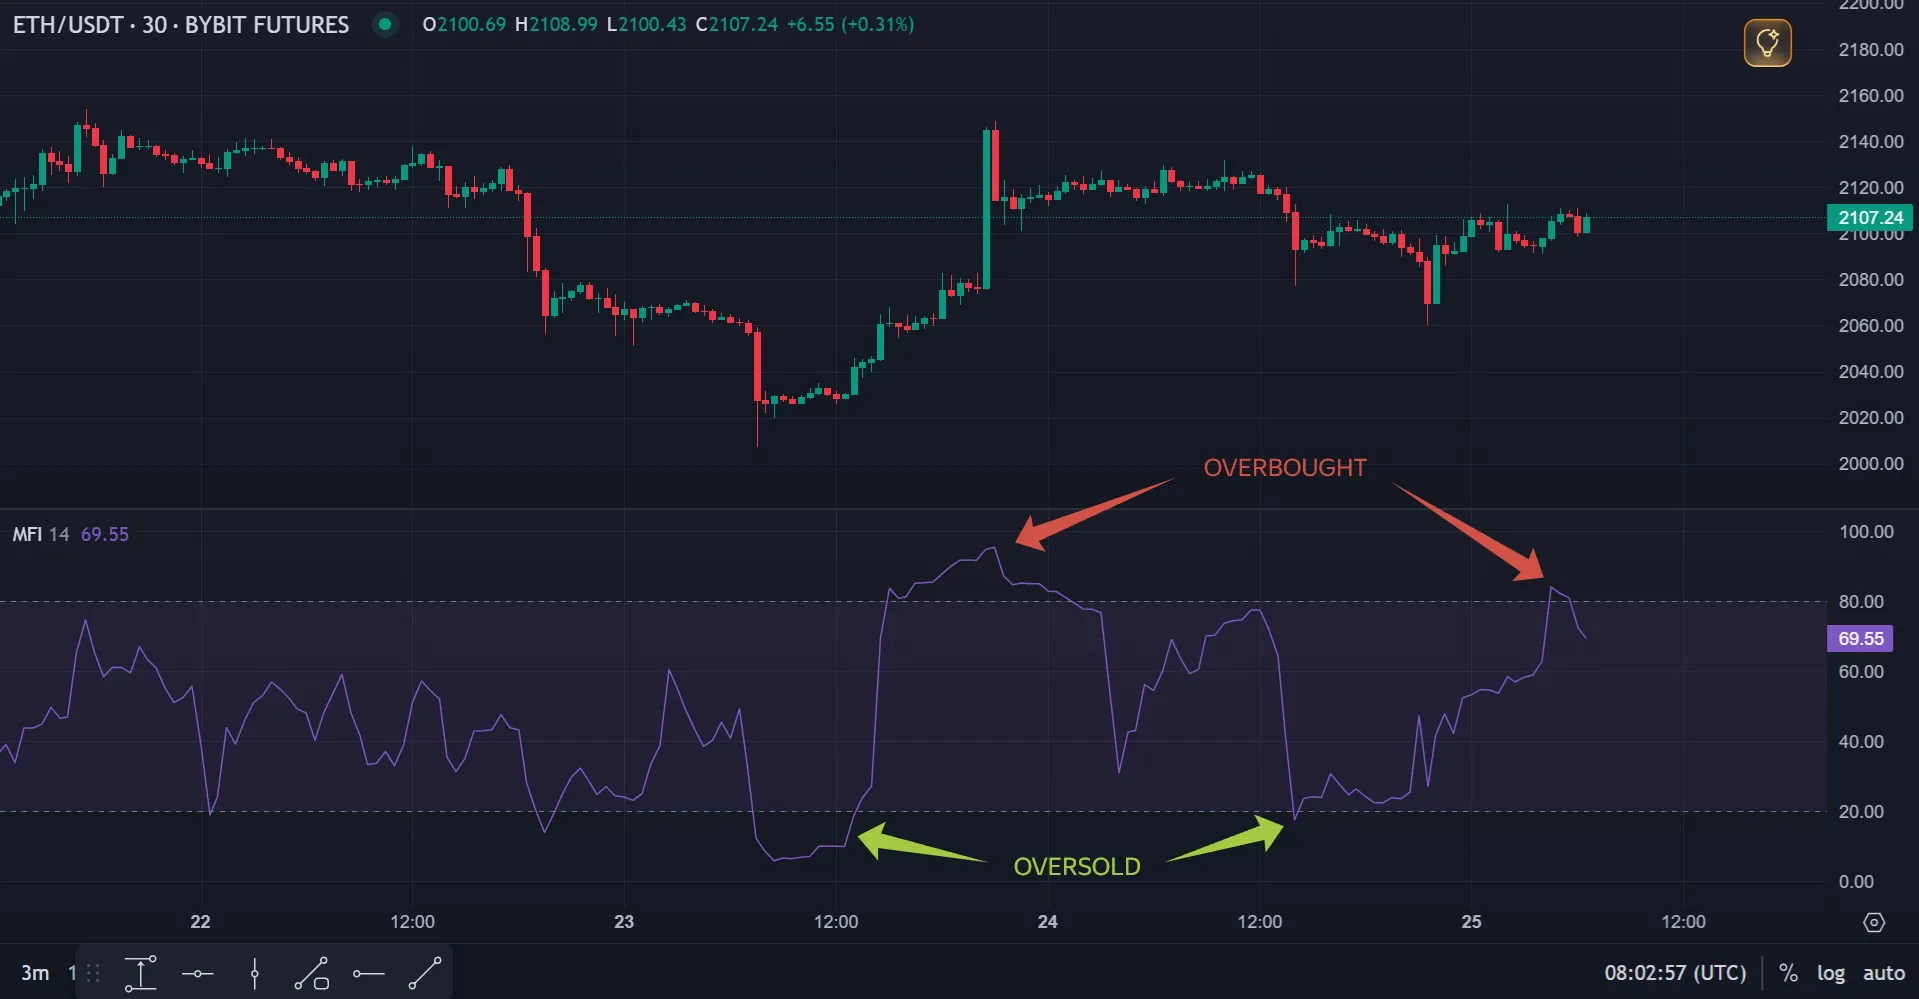
Main Signals
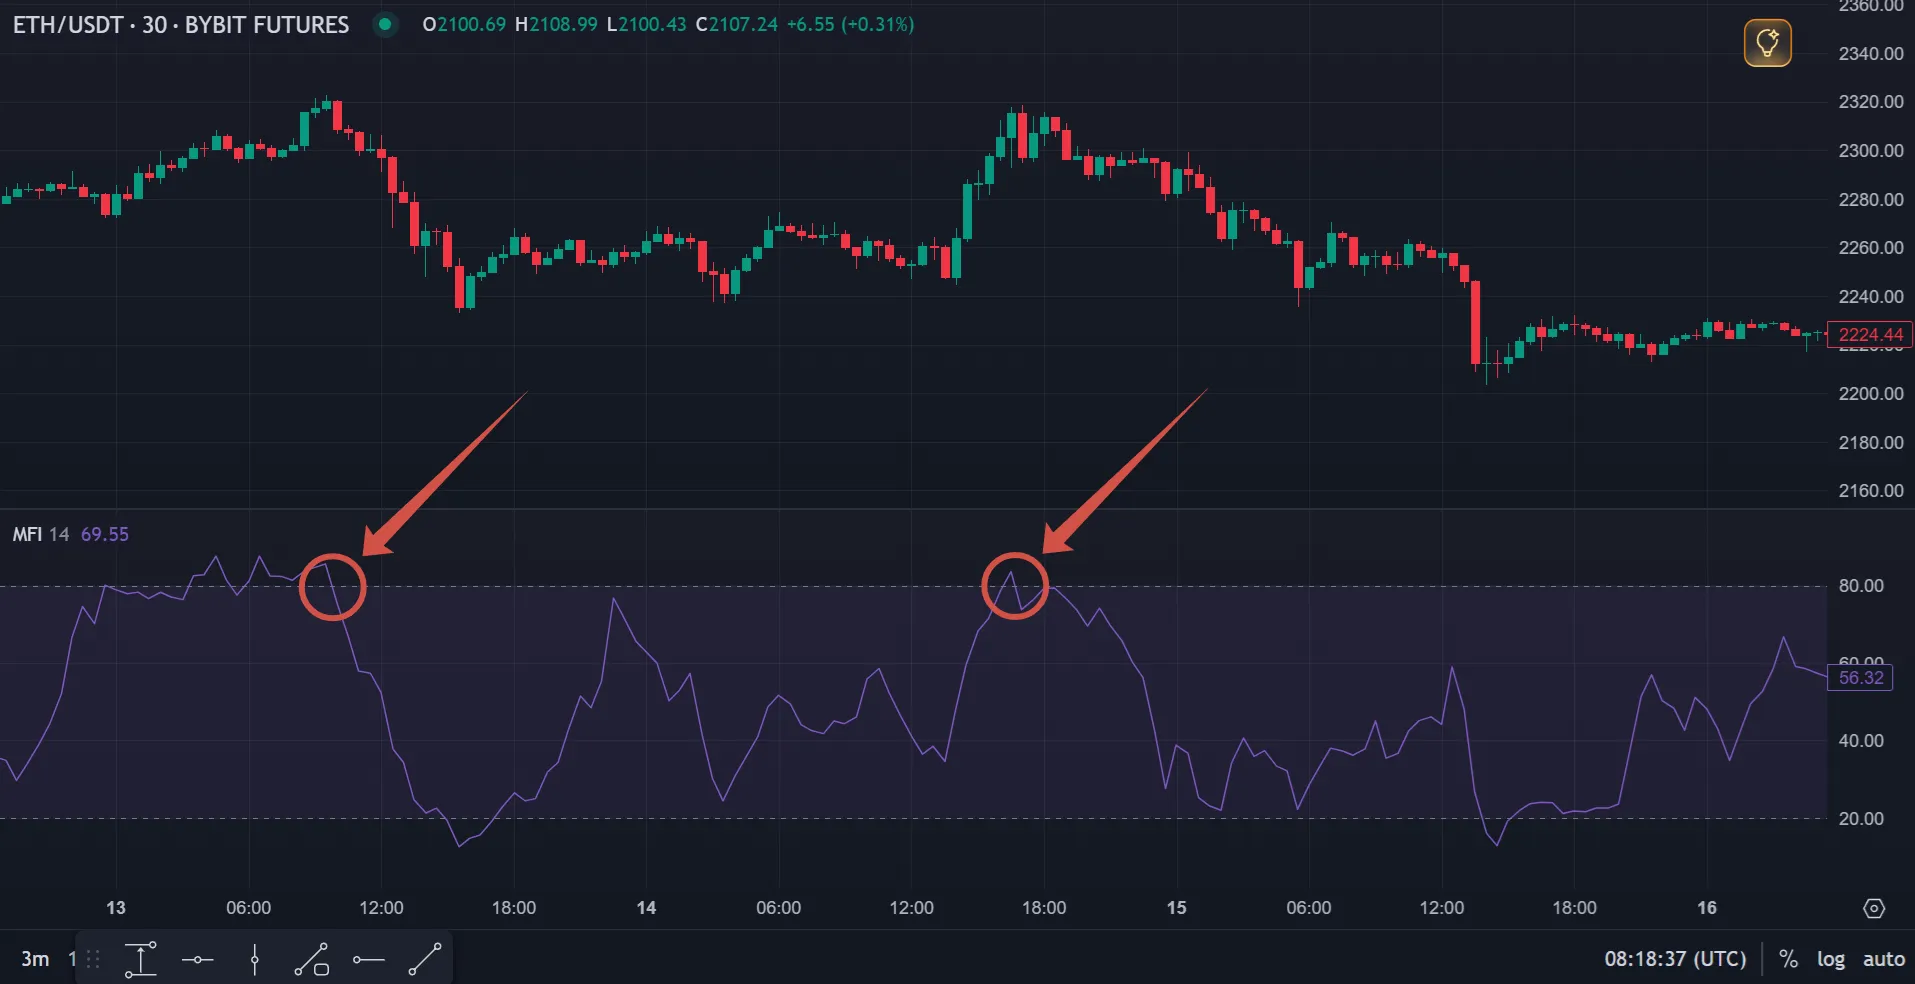
Section titled “Main Signals”- Above 80 → overbought zone (possible downside reversal, Short-signal).
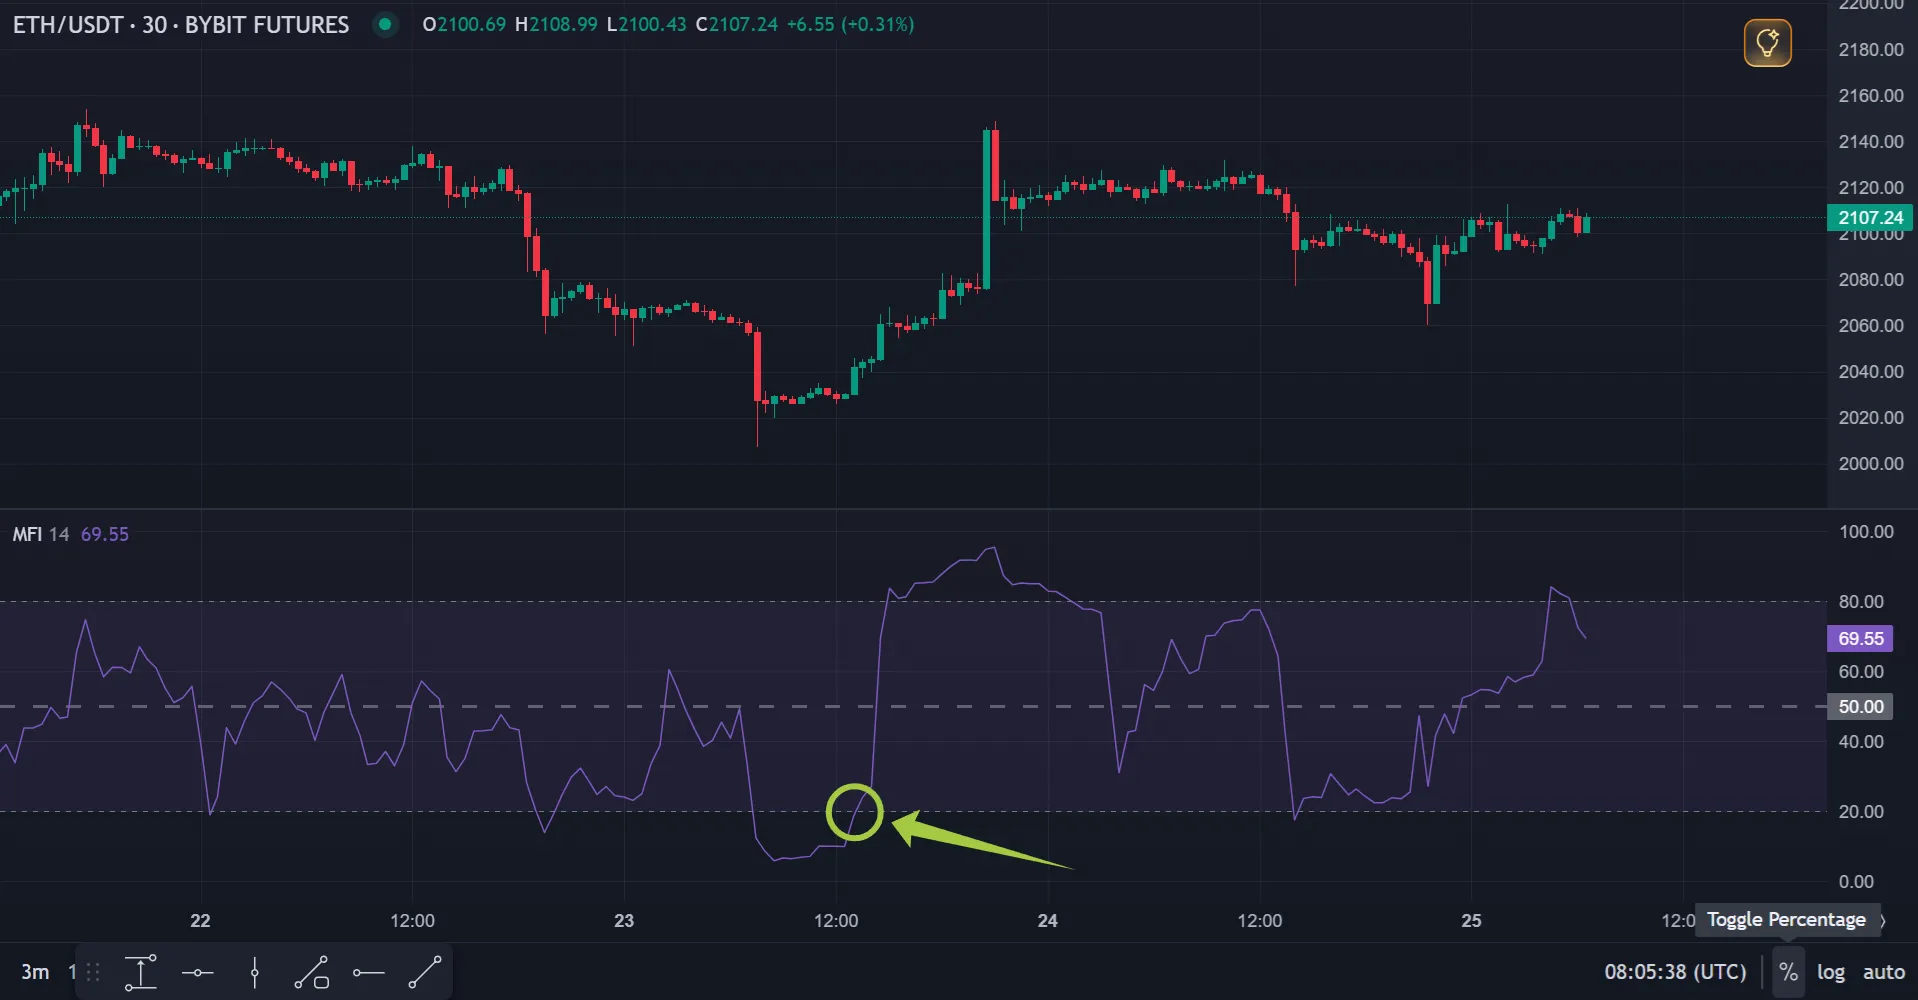
- Below 20 → oversold zone (possible upside reversal, Long-signal).
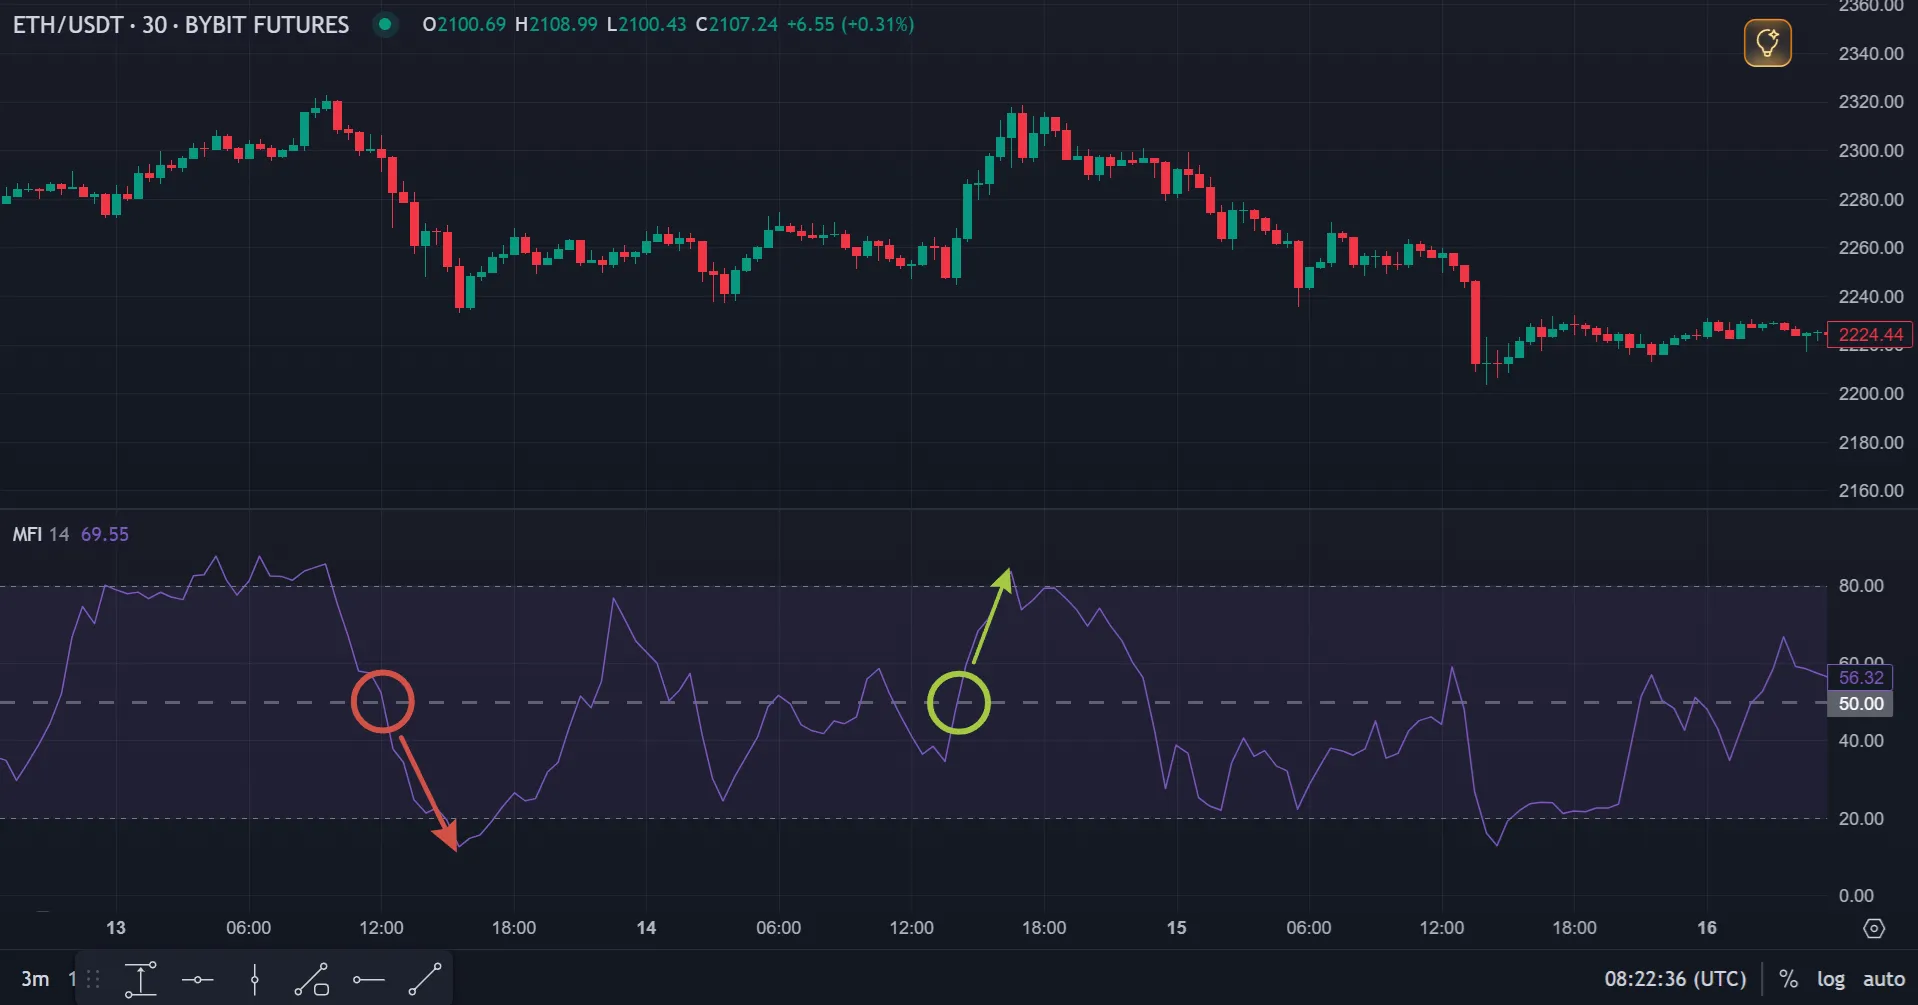
- Crossing level 50:
- Bottom-to-top → increasing buying pressure.
- Top-to-bottom → increasing selling pressure.
How to apply in trading
Section titled “How to apply in trading”- Trading by zones
- Long: open a deal when the MFI returns from the zone below 20.
- Short: open a deal when the MFI returns from the zone above 80.
- Trend Filtering Use levels 30 and 70 instead of 20 and 80 in strong trends to reduce the risk of missing signals during prolonged movements.
- Midline Crossover (50)
- Crossover from bottom to top → Buy signal.
- Crossover from top to bottom → Sell signal.
Using in Veles Bots
Section titled “Using in Veles Bots”- For a Long bot: without specifying a value — entry when MFI < 80, exit when MFI > 20.
- For a Short bot: without specifying a value — entry when MFI > 20, exit when MFI < 80.
To change the parameters, click the “Pencil” button in the indicator settings.
💡 MFI is effective when paired with other tools, such as RSI or MACD, to filter out false signals.
Limitations
Section titled “Limitations”- Like RSI, MFI can remain in overbought or oversold zones for extended periods during strong trends.
- In low-volume markets or during news spikes, the indicator may produce misleading signals.
- Best used as a filter alongside trend and momentum indicators, not as a standalone signal.
Using in Veles Bots (Flexible Indicator)
Section titled “Using in Veles Bots (Flexible Indicator)”Available settings:
- Period - the number of candles for calculation. Range: 2–100, default 14.
- Interval - the candle timeframe.
- Method - the calculation type. By bar close (only on the selected interval) or by minute (once per minute for any interval).
- Shift - shifts the requested indicator value back by the specified number of candles.
Summary
Section titled “Summary”The Money Flow Index combines price and volume data into a single momentum oscillator, making it more sensitive to real market activity than RSI alone. In Veles bots, it is most effective as a confirmation filter to ensure trade entries are backed by meaningful capital participation.