Average Directional Index (ADX)
ADX (Average Directional Index) is a technical analysis indicator that measures the strength of a trend without specifying its direction. It helps determine whether the market is trending or not.
How ADX Works
Section titled “How ADX Works”The ADX is calculated based on two additional lines:
- +DI (Positive Directional Index) — the strength of the upward movement
- -DI (Negative Directional Index) — the strength of the downward movement
Calculations are based on historical price data, taking into account:
- The difference between the current high and low
- The difference between the previous close and the current high
- The difference between the previous close and the current low
Then a smoothed ADX line is constructed based on this data, showing the intensity of price movement.
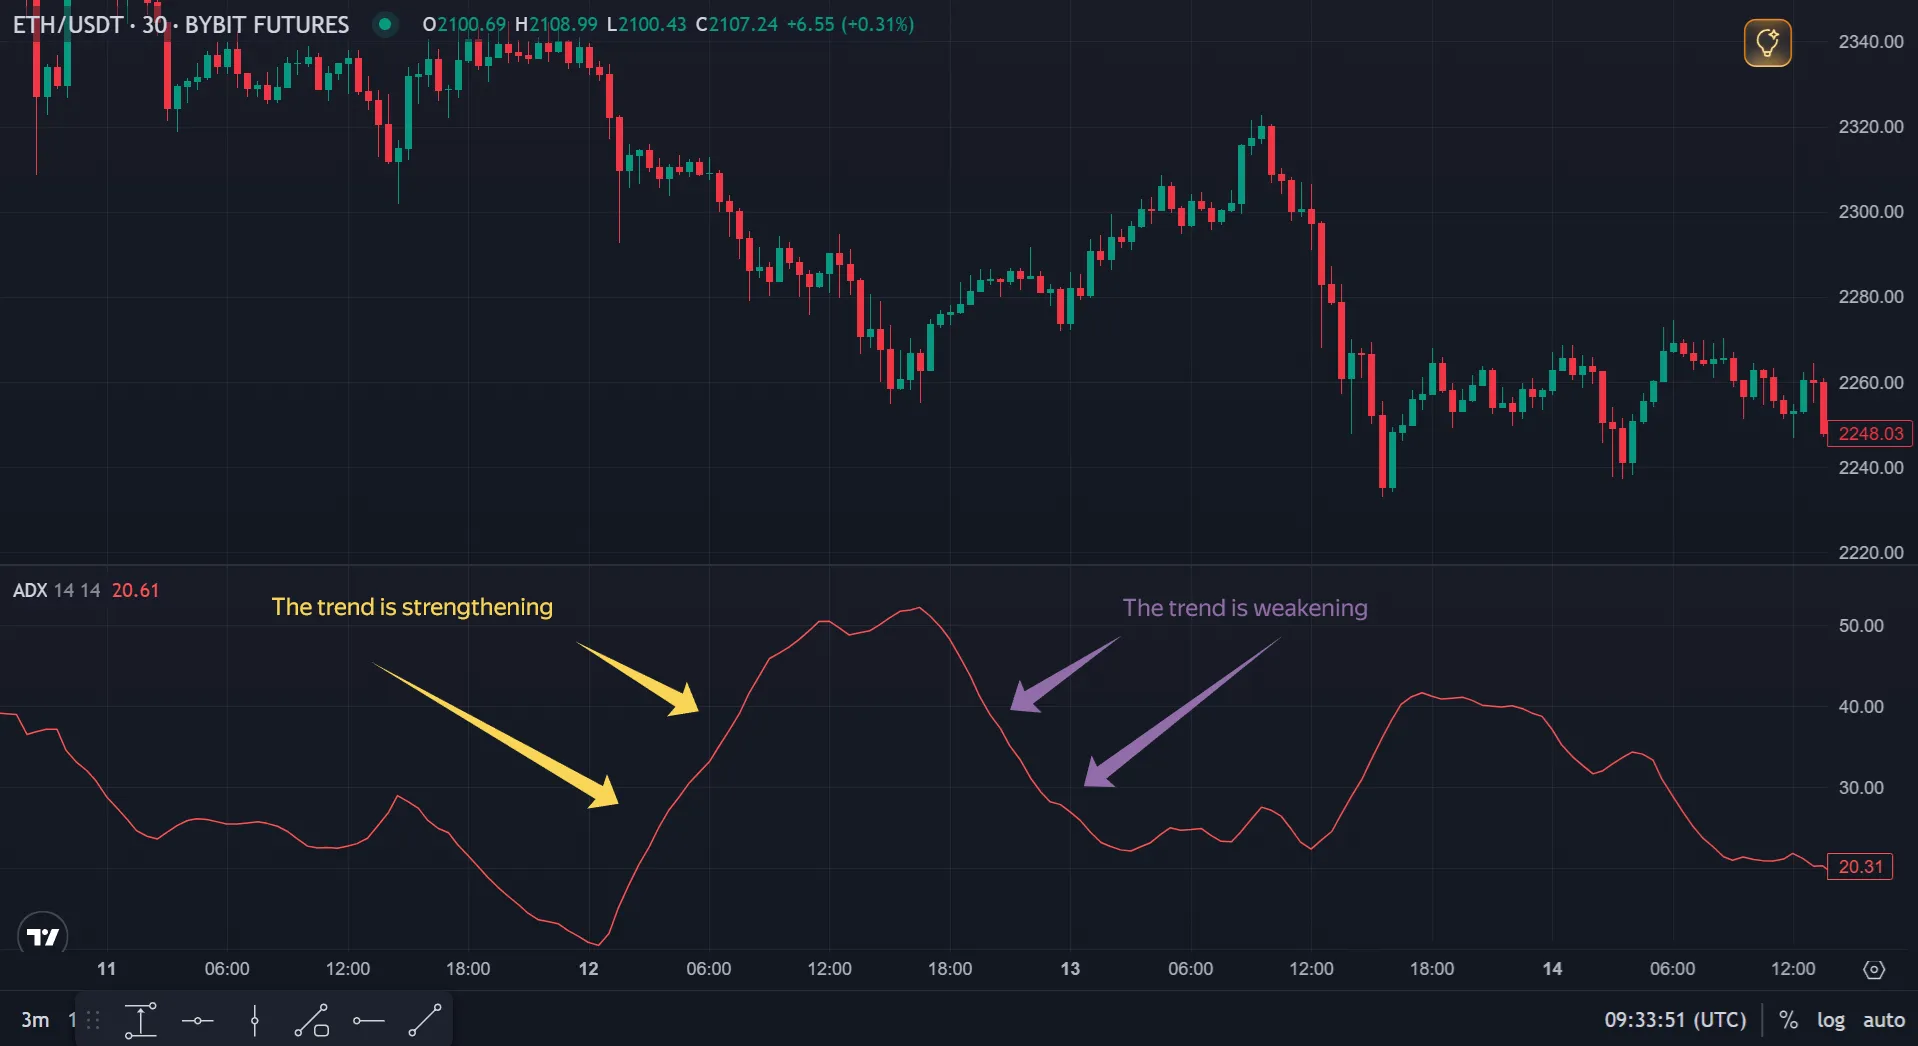
Interpreting ADX Values
Section titled “Interpreting ADX Values”The ADX value is always in the range 0-100:
- 0–20 — no trend (sideways movement, flat)
- 20–25 — trend is starting to form
- 25–50 — strong trend
- 50–75 — very strong trend
- 75–100 — extremely strong trend (increased probability of correction)
💡 Important: The ADX doesn’t show trend direction. To understand the price’s direction, analyze the relative positions of the +DI and -DI lines:
- +DI above -DI → uptrend
- -DI above +DI → downtrend
How to use ADX in trading
Section titled “How to use ADX in trading”- Trade filtering
- Open a deal only when ADX > 25 to follow a trend
- Ignore indicator signals during flat periods (ADX < 20)
- Breakout confirmation
- If ADX rises after a support/resistance breakout, the breakout is confirmed
- Close the deal
- A falling ADX indicates a weakening trend – you can partially lock in your profits
ADX in Veles Bots (Standard Indicator)
Section titled “ADX in Veles Bots (Standard Indicator)”In the Veles platform, ADX can be used as a filter for opening or closing a trade.
- If a specific value is not specified in the settings, the default condition is ADX > 25 on the selected timeframe.
- To change the threshold and timeframe, click the “Pencil” icon and set your parameters.
📌 Recommendation: For more reliable signals, use ADX on higher timeframes (1 hour and above) in combination with trend indicators, such as:
ADX in Veles Bots (Flexible Indicator)
Section titled “ADX in Veles Bots (Flexible Indicator)”Custom indicator parameters:
- Period - the number of candles for calculation. Range: 3–50, default 14.
- Interval - the candle timeframe.
- Smoothing - period for calculating the Average True Range (ATR). Range: 3–50, default 14.
- Method - the calculation type. By bar close (only for the selected interval) or by minute (once per minute for any interval).
- Shift - shifts the requested indicator value back by the specified number of candles.
Limitations
Section titled “Limitations”- ADX is a lagging indicator, so it doesn’t react instantly to sharp price movements.
- It may lag during sharp market reversals.
- It’s best used to confirm signals, not as the single decision-making tool.
Summary
Section titled “Summary”- ADX rises → trend strengthens
- ADX falls → trend weakens
- +DI above -DI → upward trend
- -DI above +DI → downward trend