Exponential Moving Average (EMA)
An Exponential Moving Average (EMA) is a type of moving average that places greater weight on recent prices. Unlike a SMA, an EMA reacts more quickly to changes in an asset’s price, making it a popular tool for active strategies and Short trading.
Trend detection using EMA
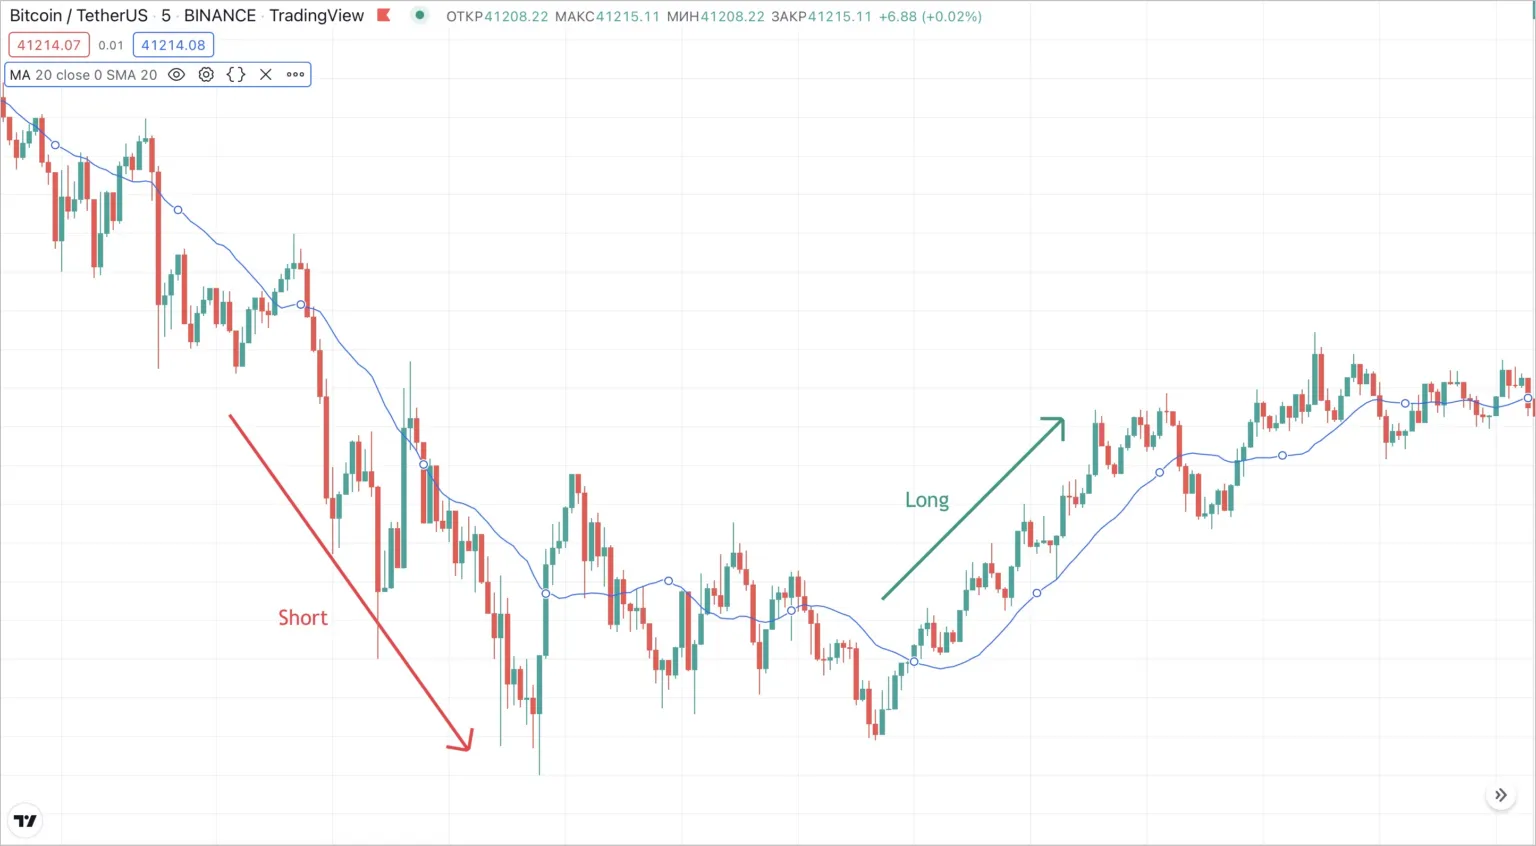
Section titled “Trend detection using EMA”The EMA indicator is highlighted depending on whether the current price is above or below:
- Price above the EMA line → Buy-signal (open Long or close Short).
- Price below the EMA line → Sell-signal (open Short or close Long).
⚡ Due to its sensitivity, EMA is suitable for working on shorter timeframes and allows for faster response to market reversals.
However, this same property makes it more susceptible to false signals.
EMA Crossover with Price
Section titled “EMA Crossover with Price”When the current price crosses the EMA line, it may indicate a local trend change:
- Top-to-bottom crossover → signal to open a Short deal.
- Bottom-to-top crossover → signal to open a Long deal.
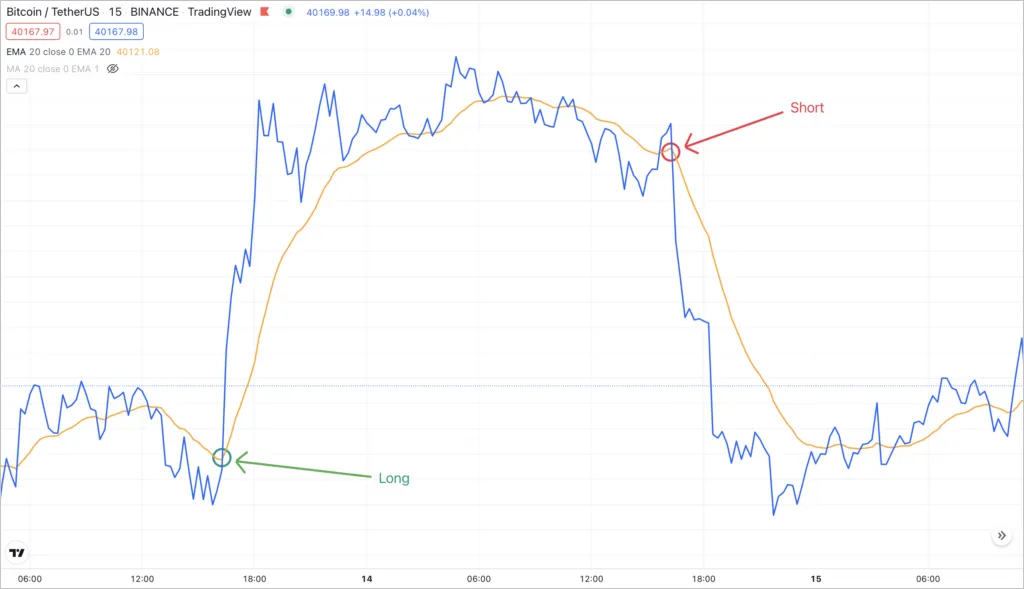
This method is often used in short-term trading to detect a breakout.
EMA Crossover with EMA
Section titled “EMA Crossover with EMA”One of the most well-known technical analysis patterns is the crossover of two EMAs with different periods. The most commonly used are the 50 EMA and 100 EMA:
- 50 EMA crosses the 100 EMA from top to bottom → Sell signal. This pattern is called the Death Cross.
- 50 EMA crosses the 100 EMA from bottom to top → Buy signal. This is the so-called Golden Cross.
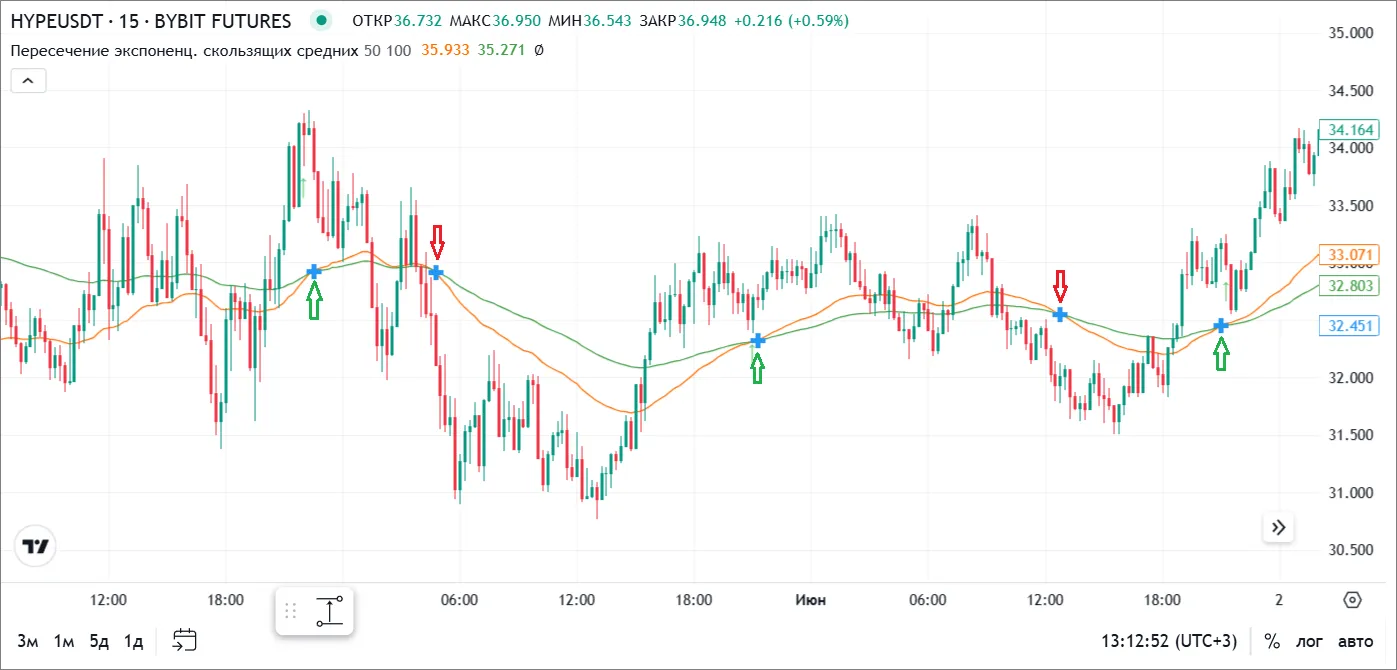
This filter is available in the Veles bot settings as “EMA 50 crosses EMA 100”.
Timeframes and Practical Application
Section titled “Timeframes and Practical Application”- The smaller the timeframe, the more signals the bot will receive, but the number of false signals also increases.
- On higher timeframes, EMA generates more reliable signals, suitable for medium- and long-term trading.
👉 There is no universal timeframe – choose periods that suit your trading style and test your strategy through backtests.
Limitations
Section titled “Limitations”- EMA is a trend indicator that shows the general direction of price movement.
- For increased accuracy, it is recommended to use EMA in combination with other indicators (RSI, MACD, ATR) and support/resistance levels.
- In Veles bots, EMA can be used as a filter for trade entry or exit, combining it with any other conditions.
- Due to its sensitivity, EMA is prone to false signals on short timeframes — always backtest before deploying.
Summary
Section titled “Summary”The EMA is a fast-reacting trend filter that adapts well to dynamic crypto markets. In Veles bots, it can define trend direction, detect crossovers, or build dual-EMA strategies like the Golden Cross — most effective when paired with a momentum indicator such as RSI or MACD.