
Backtests
Backtest is a simulation of bot trading based on historical data (1-minute candles from exchanges). You set up the bot → run the test → see the drawdowns of the strategy, execution of the Stop Losses and what Net result it could bring you.
Backtest is a required step for any strategy: purchased, taken from the training bot showcase, or your own.
To run the backtest, you must have a connection to the exchange (an active API binding in the cabinet), but no real deposit is required (for simulation, you can specify any amount).
Limits and subscriptions
Section titled “Limits and subscriptions”| Tariff | Price | Daily Accrual | Max Capacity | Concurrent Tests |
|---|---|---|---|---|
| Free | $0 | +5 years | 15 years | 1 |
| Starter | $15 / mo | +500 years | 1,500 years | 1 |
| Pro | $29 / mo | +5,000 years | 25,000 years | 5 |
| Quant | $69 / mo | +50,000 years | 250,000 years | 50 |
More information: Backtest tariffs
- “Free”: interval between re-runs is 30 sec.
- “Starter”, “Pro”, “Quant”: interval between runs is 1 sec.
All your tests, counters and subscription purchase see in the “Backtests” section.
Strategy requirements to start the test
Section titled “Strategy requirements to start the test”For the test to pass correctly:
- The bot has filters to start the deal (except for TradingView — such tests cannot run).
- The calculation method in all filters is “At bar closing” (the “Once per minute” mode is not supported in the backtest).
- Trailing stop is not used in the bot (minute candles cannot be used to restore the intra-candle price movement).
If you want to test the bot without filters, temporarily set “Price > 0” as a filter to start.
Limitations of the model (must be taken into account)
Section titled “Limitations of the model (must be taken into account)”-
Price of the order execution in the test assumed as following:
- opening the deal (by market): at the opening price of the candle after the signal,
- averaging/closing the deal: at the opening price of the candle after the signal.
In real trading, the execution will take place between the opening/closing price of the candle after the signal — therefore the results will differ.
-
Minute candle wicks are not counted in the test by default (if the checkbox not selected).
In reality, averaging/SL/TP/liquidation can take place on the wicks. But in the test, long wicks do not “catch” orders → so the test will show less Stop Losses, than real trading. Enable the option “Consider candle shadows (pessimistic)” or “Calculate on tick data” if you use fixed Stop Losses. -
See not only the numbers, but also the deals on the chart: this way the mechanics of the strategy and the causes of drawdowns are clearer.
-
A “Pulling up” in the backtest is calculated by the closing price of the candle (in real trading, by ticks).
-
In the very first trades during the testing period, there may be errors in signal calculation, since there are not enough previous candles to calculate the indicators (for example, 200 are needed).
Recommendations for starting
Section titled “Recommendations for starting”- Check the start/end date of the period each time.
- Specify the correct commissions of the exchange (read more about rates).
- On the test start window, look at size of the wicks (p0.99) and adjust the SL: recommended SL ≈ 2 × corresponding wick.
- Give the tests informative names (for example:
BTC 1ord SL_6% DCA_30/60 BB_15).
How to run a backtest
Section titled “How to run a backtest”Start the test from the bot editor (“Test” button) or from the bot card.
It will open a window with the parameters:
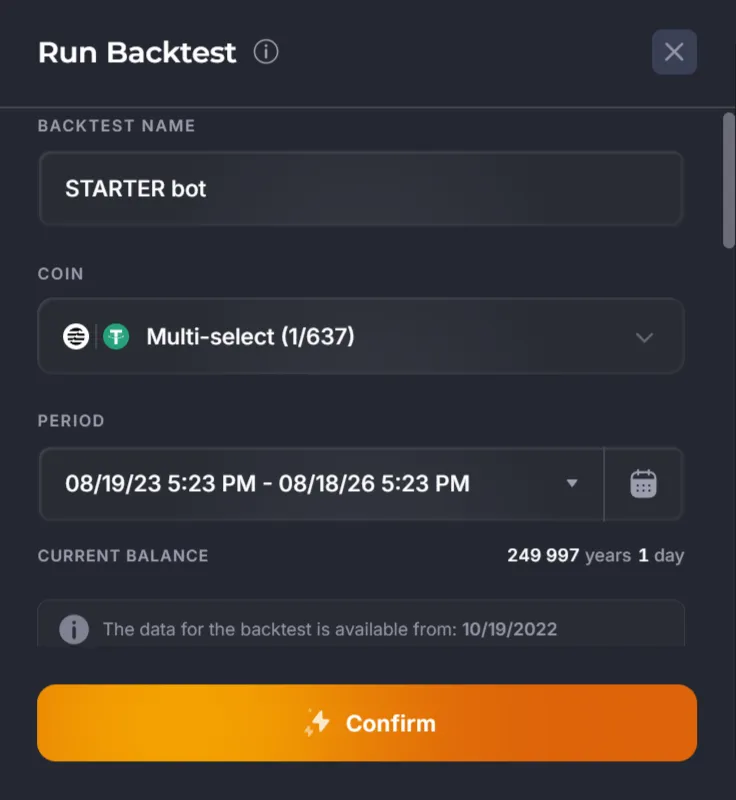
- “Backtest name” should be unique and informative (it cannot be renamed later).
- “Period” (depends on the accumulated years of your tariff).
- “Candles” — how many candles are available, how many will be included in the test, wick lengths (important for SL).
- If you have SL in the bot, take at least 2 × lower wick for Long algorithm (for more information, see the article about Stop Loss). It is better if SL lays beyond the longest wick in the period.
- “Commission” — set the actual rates of your exchange.
- “Public test” — test will be included in the public database (and can be shared in the newsletter/showcase). In paid tariff, you can disable this option.
- “Consider candle shadows (pessimistic)” — activates a conservative scenario. The following orders are considered as triggered when they hit the candle wick:
- limit grid orders,
- limit Take Profits,
- simple Stop Losses (not the indicator-triggered ones).
Option is not available when “Calculate on tick data” option is active.
If TP and SL intersect in one minute, only Stop Loss will be counted.
- “Calculate on tick data” - improves backtest accuracy:
- only available on the Bybit Futures exchange,
- available to users with the “Pro” and “Quant” plans,
- not available for testing the last (current) calendar day,
- not available when “Consider candle shadows (pessimistic)” is active.
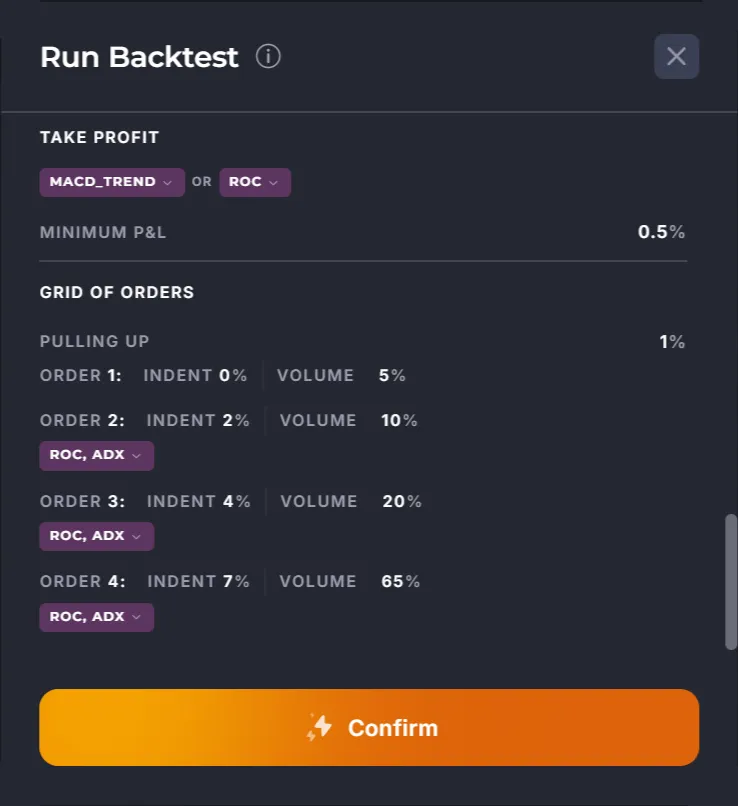
Check the summary of parameters and click “Confirm”:
How to read the results
Section titled “How to read the results”When the test is finished, you will see a screen with a graph and tabs.
- Advice: Switch the chart to the minimum timeframe that was used in the trade entry filters.
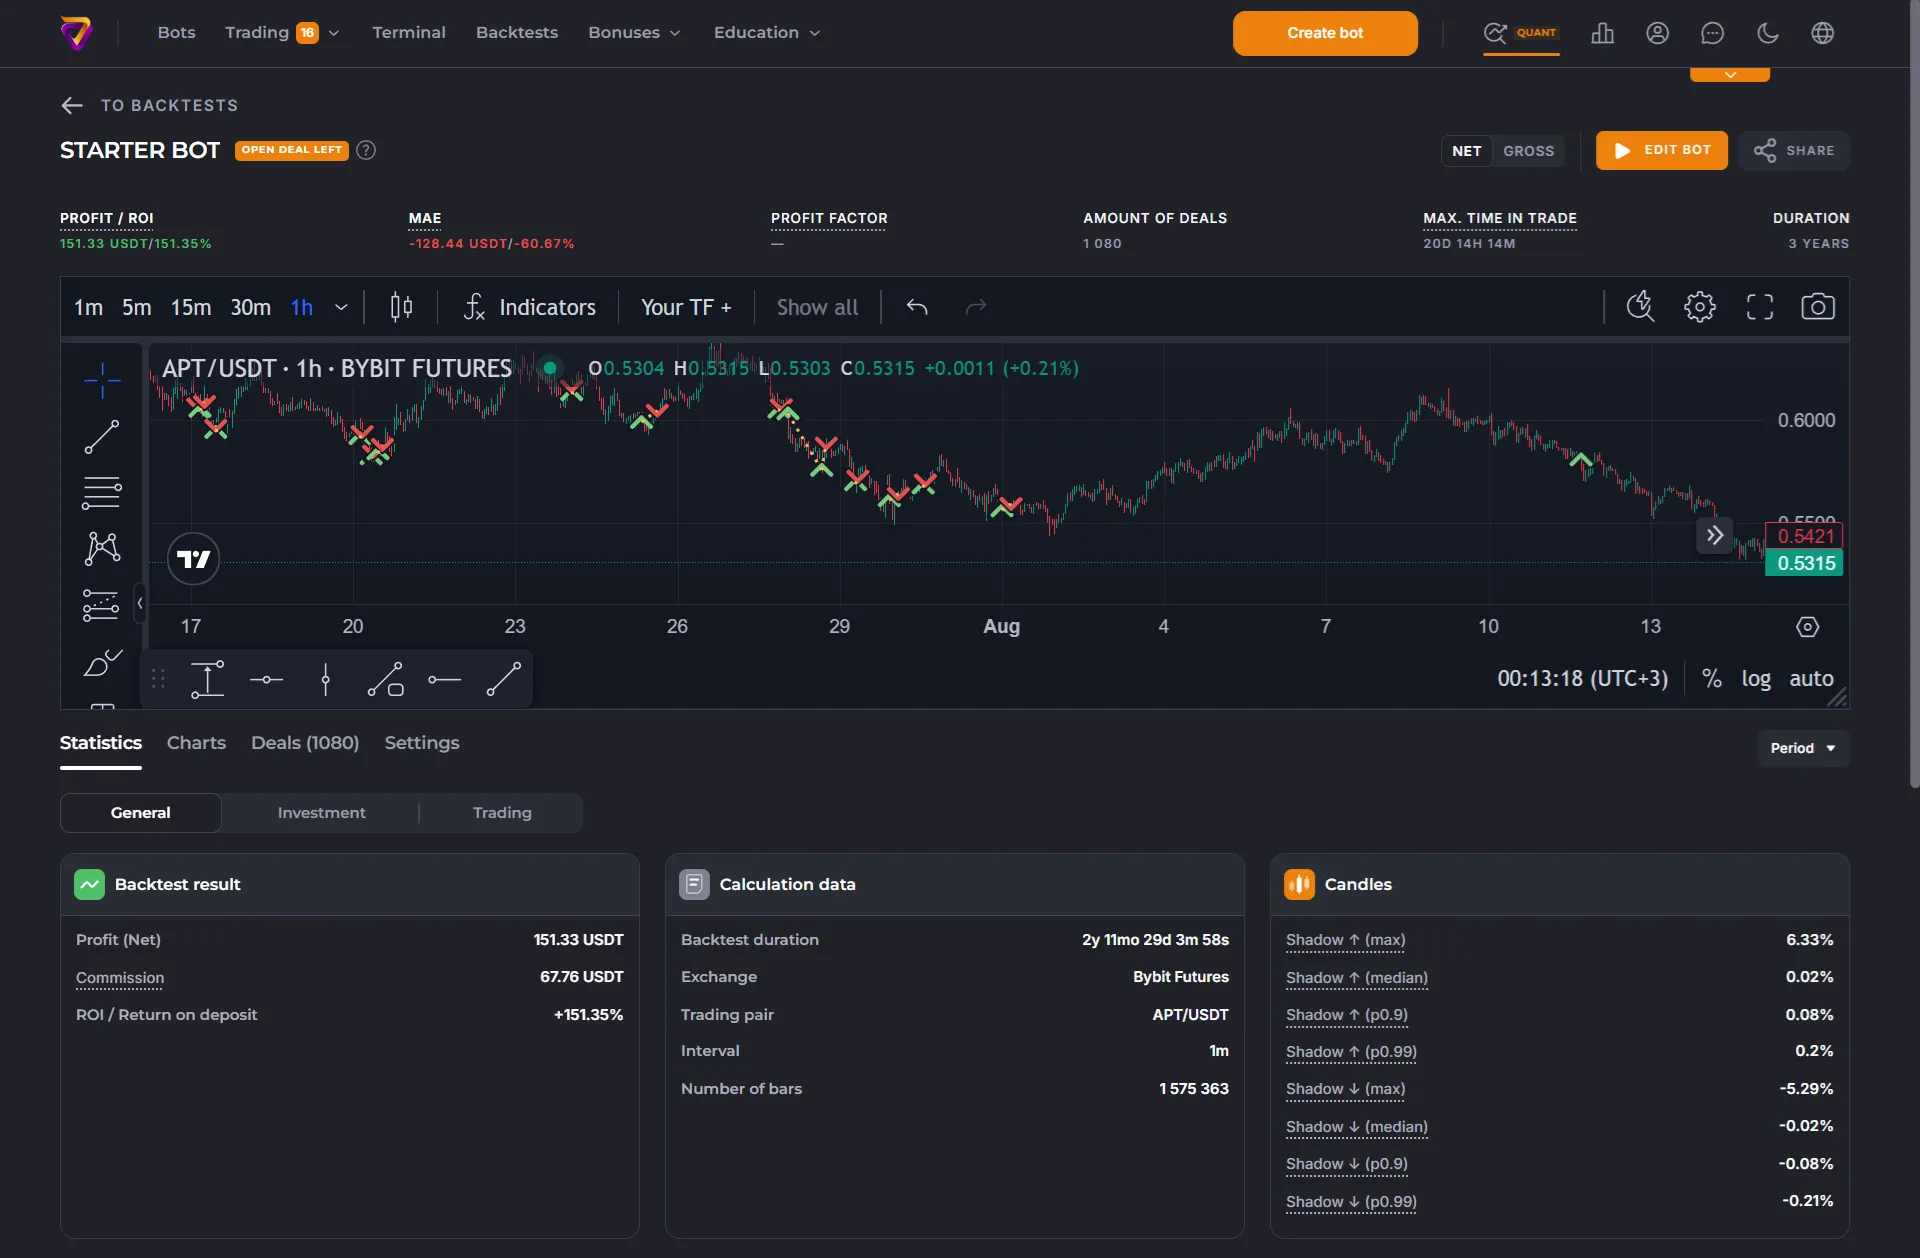
In the top-left corner, next to the TEST NAME in the header, a tag is displayed — a preliminary assessment of the strategy, a specific feature detected in the result.

- Loss-making strategy: final Net-profit is below zero.
- Open deal left: an unclosed deal remained at the end of the backtest.
- High deposit load: maximum drawdown (MAE) relative to the deposit > 80%.
- Poor profit-to-risk ratio: Recovery Factor < 1.
- Long losing streak: the actual sequence of losing deals exceeded the statistically expected length.
- Underperforms Buy & Hold: comparison with Buy & Hold strategy < 0.
- Good result: key metrics meet the specified criteria for a good result.
- Insufficient data: backtest data is insufficient for an assessment (number of closed deals < 30).
Tags are always calculated based on Net-profit (the profit type toggle does not affect them).
Also in the test header there is a profit type switch: Net/Gross.
- GROSS shows the strategy’s result without taking trading commissions into account.
- NET shows the result with trading commissions taken into account - this is the main indicator of the strategy.
- When switching between Gross and Net, some indicators are recalculated, as the profitability of individual deals may differ after commissions are taken into account.
- When switching, the cumulative profit graph is recalculated.
- Depending on the selected mode, not only the final profit and ROI may change, but also PnL-related indicators: the number of profitable/unprofitable deals, Win Rate, Profit Factor, Recovery Factor, expected value, loss streaks, etc.
- Metrics that are independent of the trade’s financial result, such as deal duration or MAE, are not affected by the switch.
For more information on the Net/Gross indicators, see the Statistics section.
“Edit Bot” button – opens a copy of this strategy in the configurator (not a saved bot).
Use a “Share” button on the top right to get a link to the test (attach it to the support requests). Link example: https://veles.finance/share/cPgdc.
Examine the tabs under the chart:

“Statistics” Tab
Section titled ““Statistics” Tab”Divided into three subsections.
”General” Section
Section titled “”General” Section”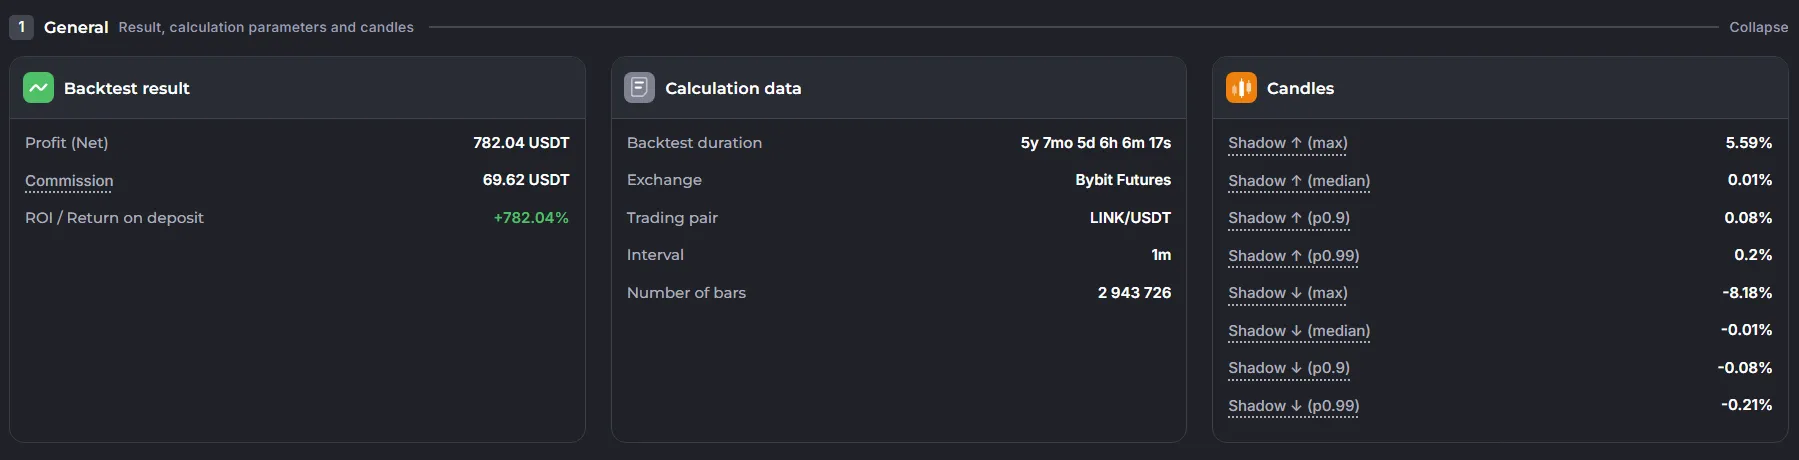
Backtest Result
- Profit: Net or Gross, depending on the toggle setting.
- Commission: exchange trading fees for all trades in the test (specify your actual commission rates when launching the test).
- ROI / Return on Deposit: calculated using the formula
ROI = selected profit / initial deposit × 100%
Calculation Data
- Backtest duration.
- Exchange.
- Trading pair.
- Interval: the candles timeframe used in the calculations.
- Number of bars: the number of candles used in the backtest.
Candles
- Shadow up (max.)
- Shadow up (median)
- Shadow up (p0.9)
- Shadow up (p0.99)
- Shadow down (max.)
- Shadow down (median)
- Shadow down (p0.9)
- Shadow down (p0.99)
It is important to know the Shadow sizes before running the test if the strategy uses a Stop Loss.
”Investment” Section
Section titled “”Investment” Section”
Time-based Return
- Efficiency per day: Net profit for the period / total time spent in trades. Useful for strategies with infrequent entries.
- CAGR: Compound Annual Growth Rate. Shows the average annual percentage growth of profit.
Market Comparison
- Buy & Hold Return: the result that would have been achieved by simply holding the asset.
- Compared to Buy & Hold: a positive value indicates that the strategy gave a higher return than Buy & Hold, while a negative value indicates that simple holding the asset produced a better result.
- Compared to Buy & Hold, drawdown included: determines whether the strategy retains its advantage over Buy & Hold after accounting for its maximum drawdown. A positive value means the strategy remains more effective than Buy & Hold even when drawdown is considered; a negative value means Buy & Hold performs better. The drawdown of the Buy & Hold strategy itself is not taken into account.
Risk / Return
- Profit Factor: the sum of profits from profitable deals divided by the absolute value of the sum of losses from losing deals.
- Recovery Factor: the extent to which the strategy’s total profit exceeds its maximum drawdown. The higher the value, the better the ratio of profit to drawdown risk.
- Calmar Ratio: the extent to which the strategy’s average annual return justifies its maximum drawdown. The higher the ratio, the greater the return generated by the strategy relative to the drawdown.
Drawdown
- MAE (Maximum Adverse Excursion): drawdown percentage from the average position price and its absolute value (USDT) — a key risk metric. Note: the test does not account for the wick of the 1-minute candle → in the live market, the drawdown based on the wick can be deeper.
- MAE relative to deposit: maximum floating loss as a percentage of the bot’s deposit. This helps determine how much capital buffer the strategy required to withstand the most severe drawdown.
If there is a SL in the strategy and it was triggered in the test, the MAE is taken by the minute candle, where that SL was fixed. It means, that in strategy with SL you do not need to take MAE into account, but pay attention to the size of the fixed Stop-losses (in the list of deals).
A high MAE indicates that the strategy fell into the drawdown — this is normal, take this value into account for allocating the supporting margin.
”Trading” Section
Section titled “”Trading” Section”
Trades
- Total: number of deals.
- Volume: sum of volumes of all executed orders (opening + closing).
- Amount of profitable deals.
- Amount of unprofitable deals.
- Pull ups: deals cancelled if the bot’s first order is placed at an offset.
- Win Rate: percentage of profitable trades.
For more details on the Pull up mechanics, see the article on Trading mode.
Often, the “Total” number of deals is one less than the sum of TP/SL deals because the final deal was not closed within the period.
Deal Results
- MFE: Maximum Favorable Excursion (maximum floating profit); the peak positive PnL for a trade (or over the entire test).
- MFE to Deposit: Maximum Favorable Excursion as a percentage of the bot’s deposit.
- Average Deal: arithmetic mean deal size.
- Maximum Deal.
- Minimum Deal.
Time
- Time in deals: the portion of the backtest period during which the strategy held open trades (including any currently active trade). This helps you understand how actively the strategy utilized capital and how long that capital was committed to trading.
- Average time in trade: the arithmetic mean duration, excluding any active, open trade.
- Maximum time in trade: excluding any active, open trade. Look for long-term investments; you can also sort the list on the “Deals” tab.
- Minimum time in trade: the shortest trade.
Stop-Losses
- Expected max losing streak: the number of consecutive losing trades that can be statistically expected given the current win rate and number of trades. This helps assess what constitutes a normal losing streak for the strategy—one that does not necessarily indicate a deterioration in performance.
- Actual max losing streak: the maximum number of consecutive losing trades that actually occurred during backtesting. This helps gauge the longest losing streak the strategy has already withstood.
- Worst streak reserve: the total loss incurred by the strategy during its worst sequence of consecutive losing trades. This helps determine the capital amount that would have been required to weather such a streak.
How to assess the risk of liquidation (simplified)
Section titled “How to assess the risk of liquidation (simplified)”- Cross margin: liquidation ≈ when MAE ≥ account balance.
- Isolated margin, 1 order: liquidation ≈ when MAE ≥ deposit (in real trade earlier, ~75% drawdown).
- Isolated margin, grid: liquidation ≈ when MAE of the position ≥ Initial Margin in the position (IM depends on the number of executed orders). Backtesting currently doesn’t take into account changes in position margin. You need to manually select the grid parameters, so the position of the bot does not get liquidated until the last order is executed.
How to calculate the supporting margin more accurately (recommended)
Section titled “How to calculate the supporting margin more accurately (recommended)”- Take %MAE from the backtest and the maximum wick % (lower one for Long / upper one for Short).
- Sum up %MAE + %max. wick.
- Multiply the received % by position volume (deposit × leverage). You will receive the drawdown of the strategy.
- In fact, liquidation begins earlier, so we recommend keeping either 2xMAE or 2xDeposits on your balance - take the greatest of these values.
The Charts tab
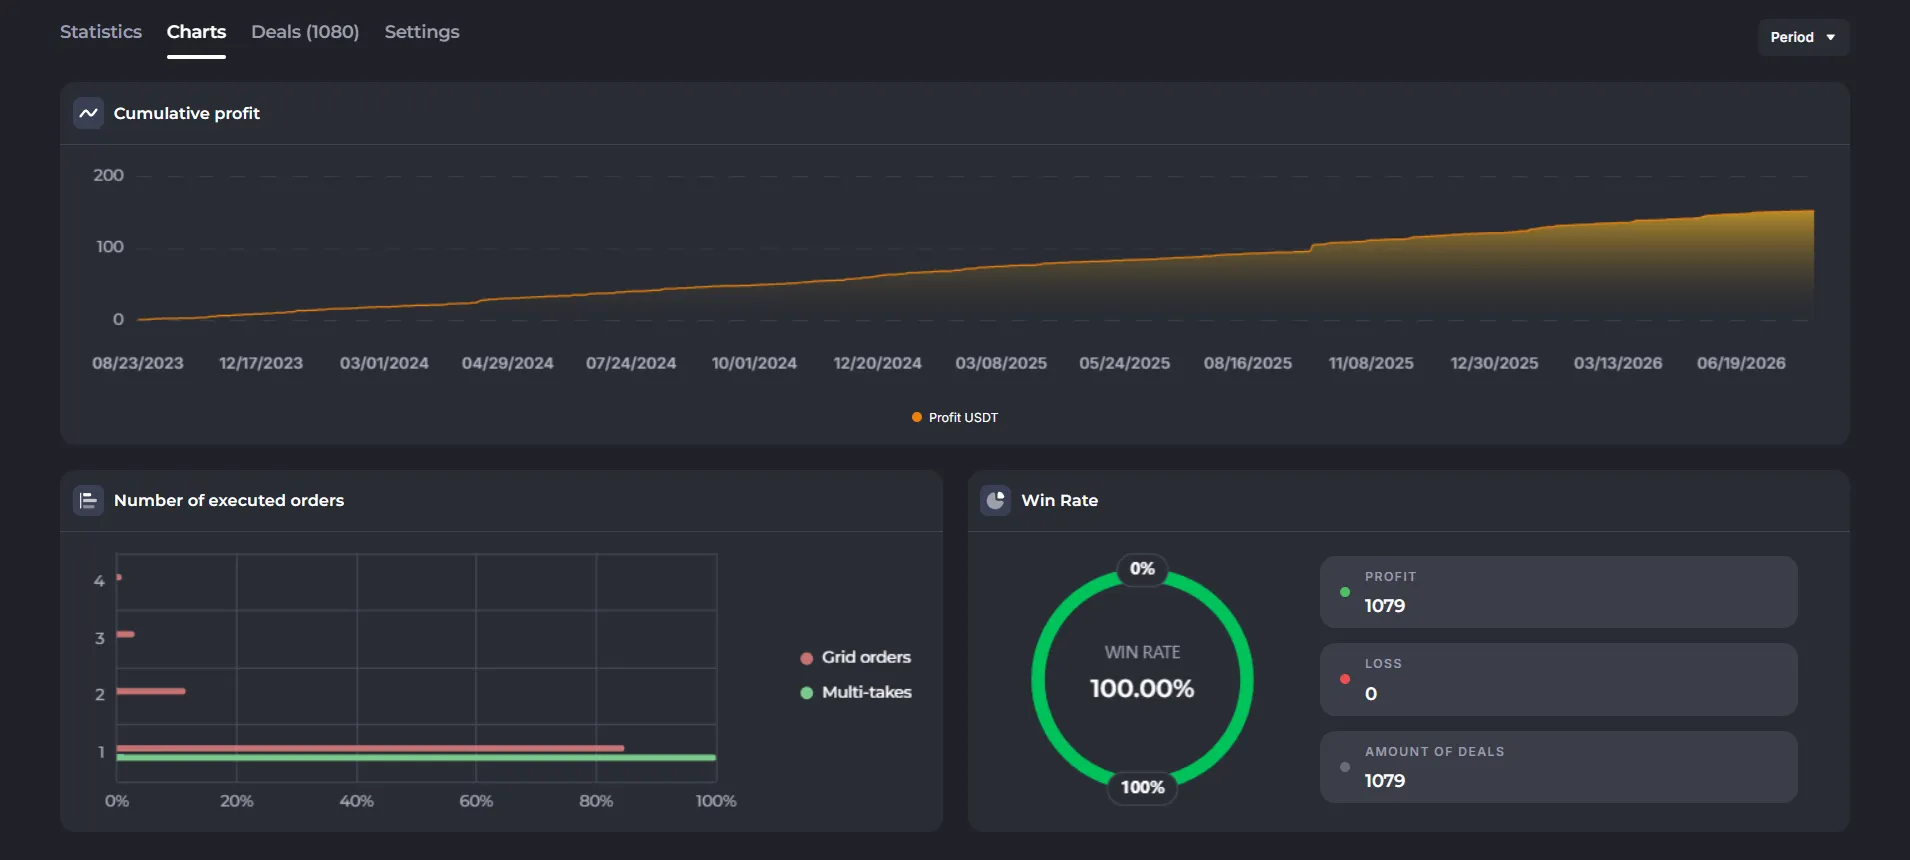
Section titled “The Charts tab”- Win rate, distribution of outcomes, cumulative profit over time.
- Allows you to quickly see when the strategy earns and where it loses.
Deals tab
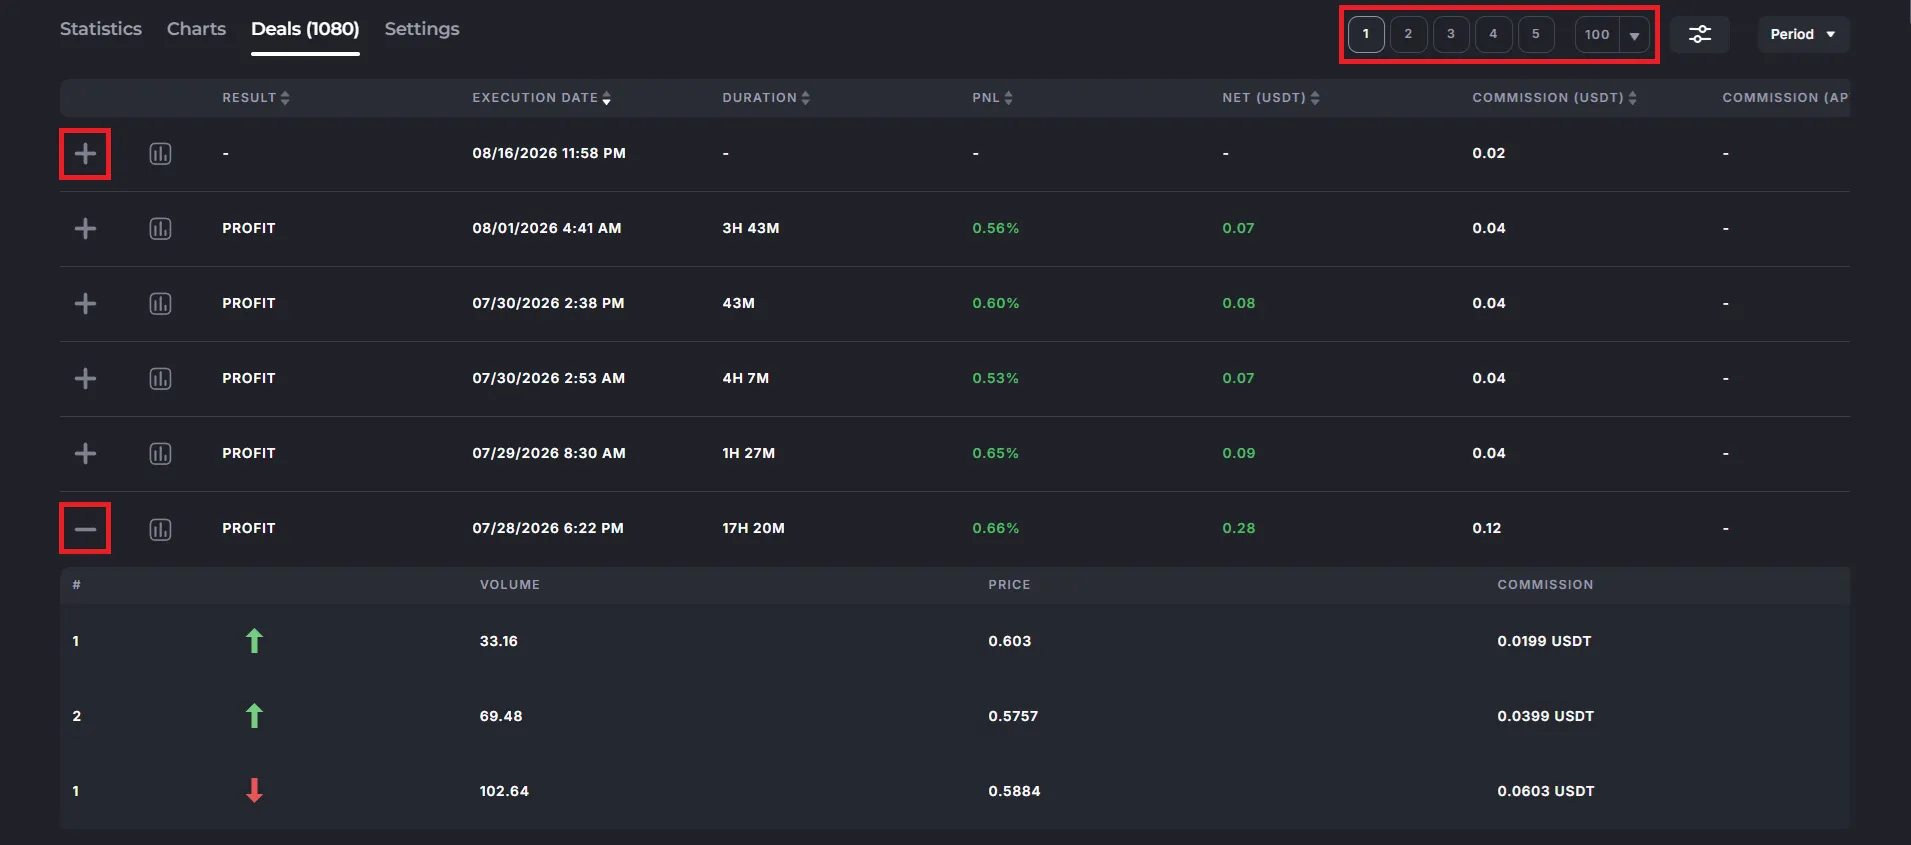
Section titled “Deals tab”Here is a detailed analysis of each simulated deal. The table is wide — scroll to the right. Typical columns: Start/End, Duration, Result, PnL, Commission, MAE/MFE, Orders executed/cancelled, etc.
Example:
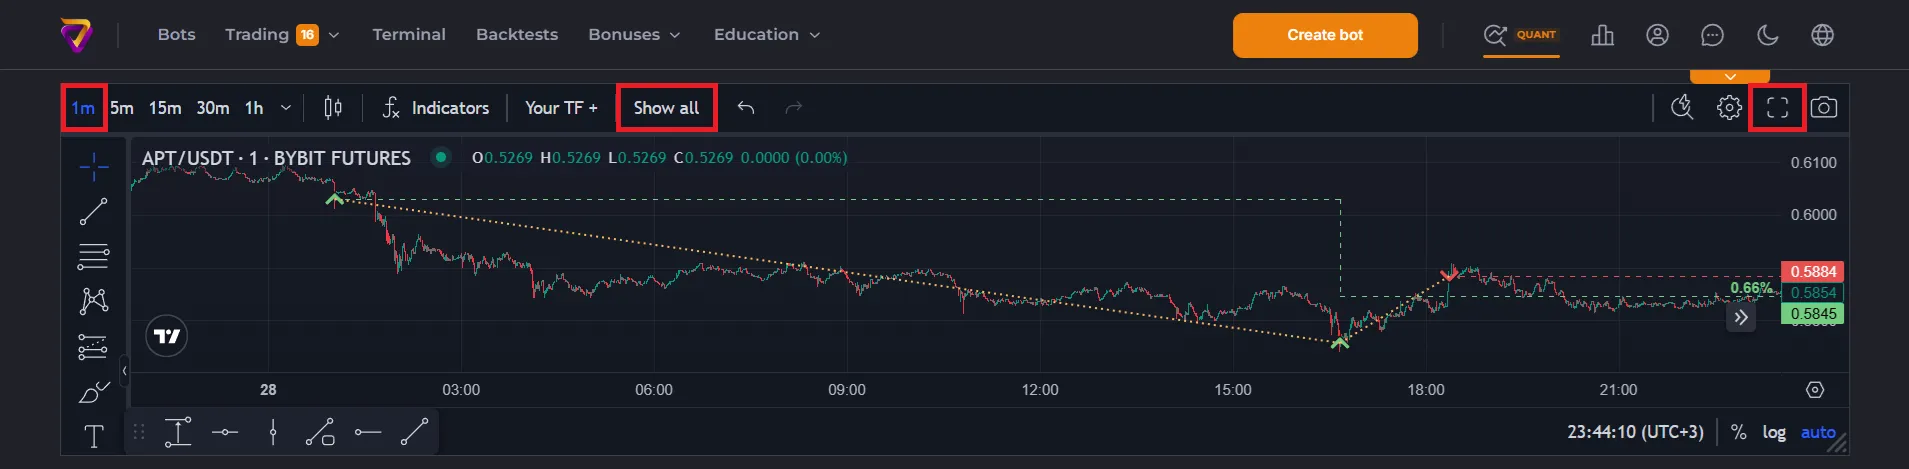
- Green arrows — executed averagings.
- Dashed line — average position price.
- Dotted line - connecting orders belonging to the same deal.
To fix the profit, the price must reach above the average price. If the deal stays long under the average price, it is called invest state.
Chart can display all deals from the current page (up to 100) — click “Show all”. It is recommended to observe them in full-screen (‘corners’ button or use Shift+F).
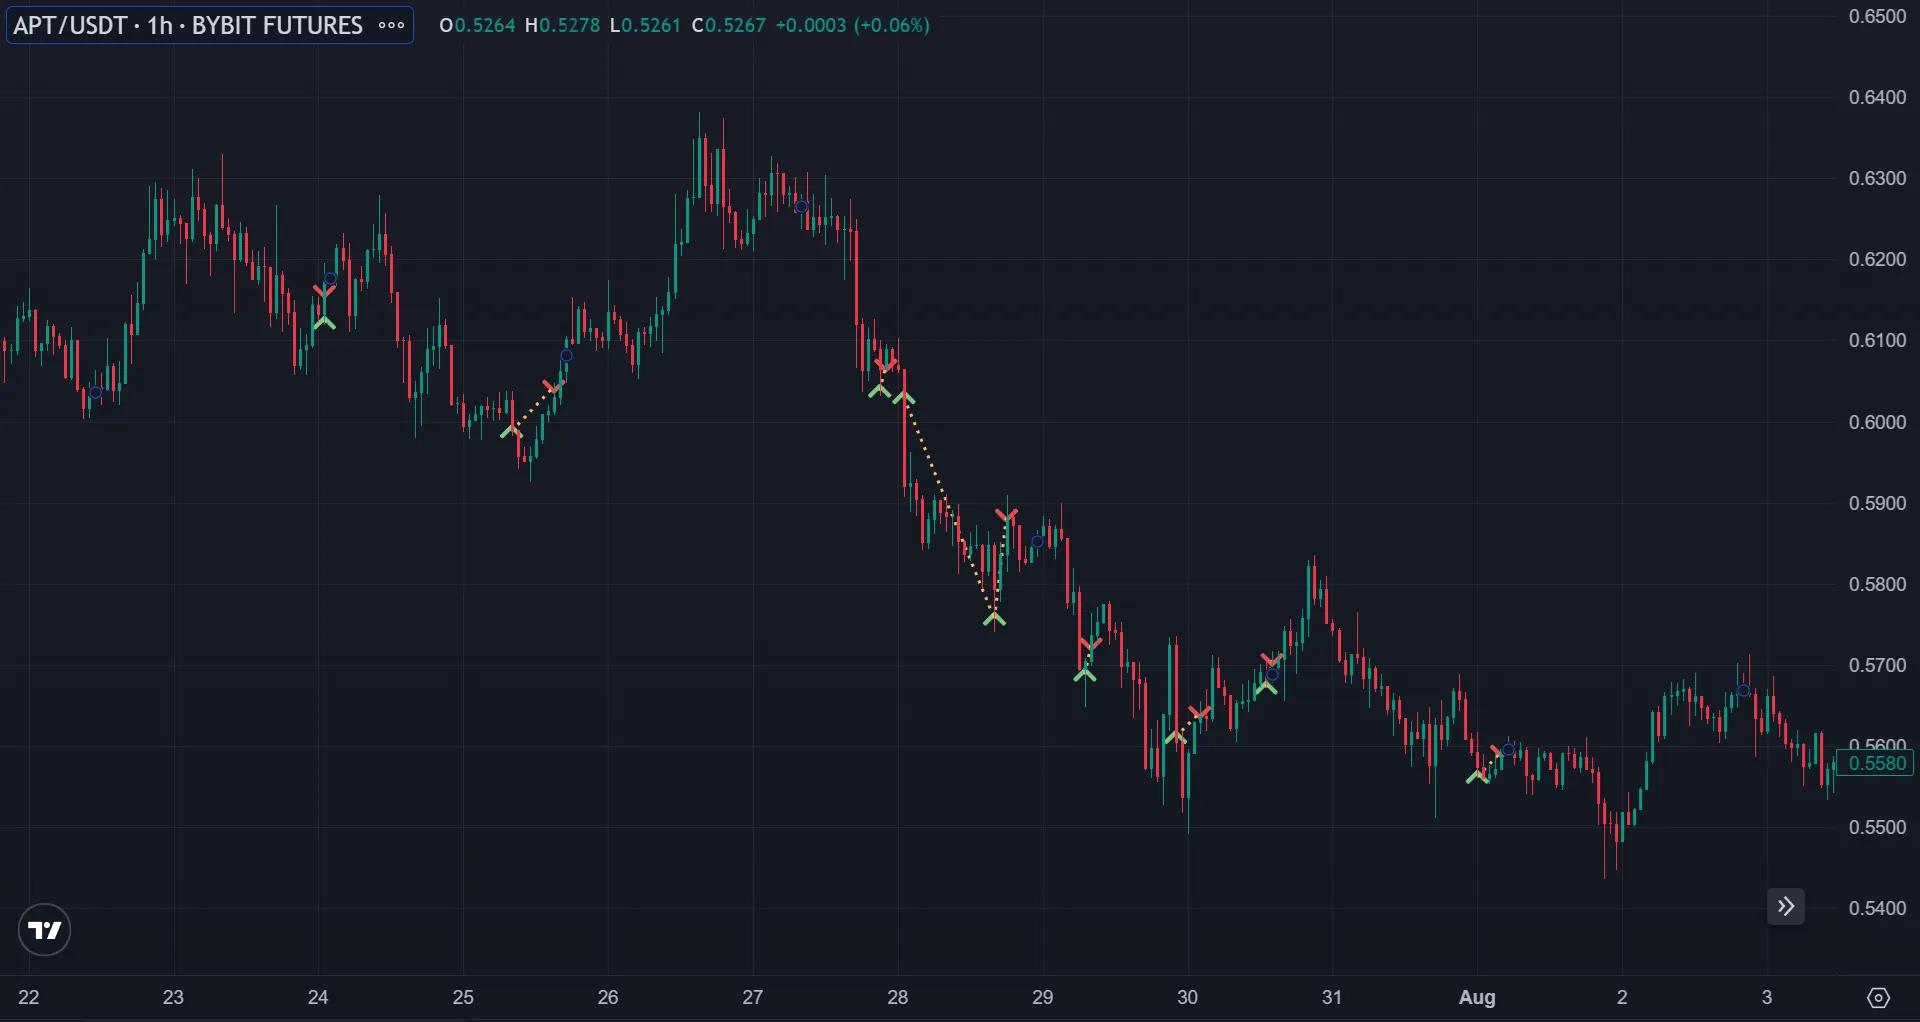
Scroll through the chart to the left to see the previous trades.
The “Settings” tab
Section titled “The “Settings” tab”Shows all parameters of the tested configuration and the exact dates of the test.
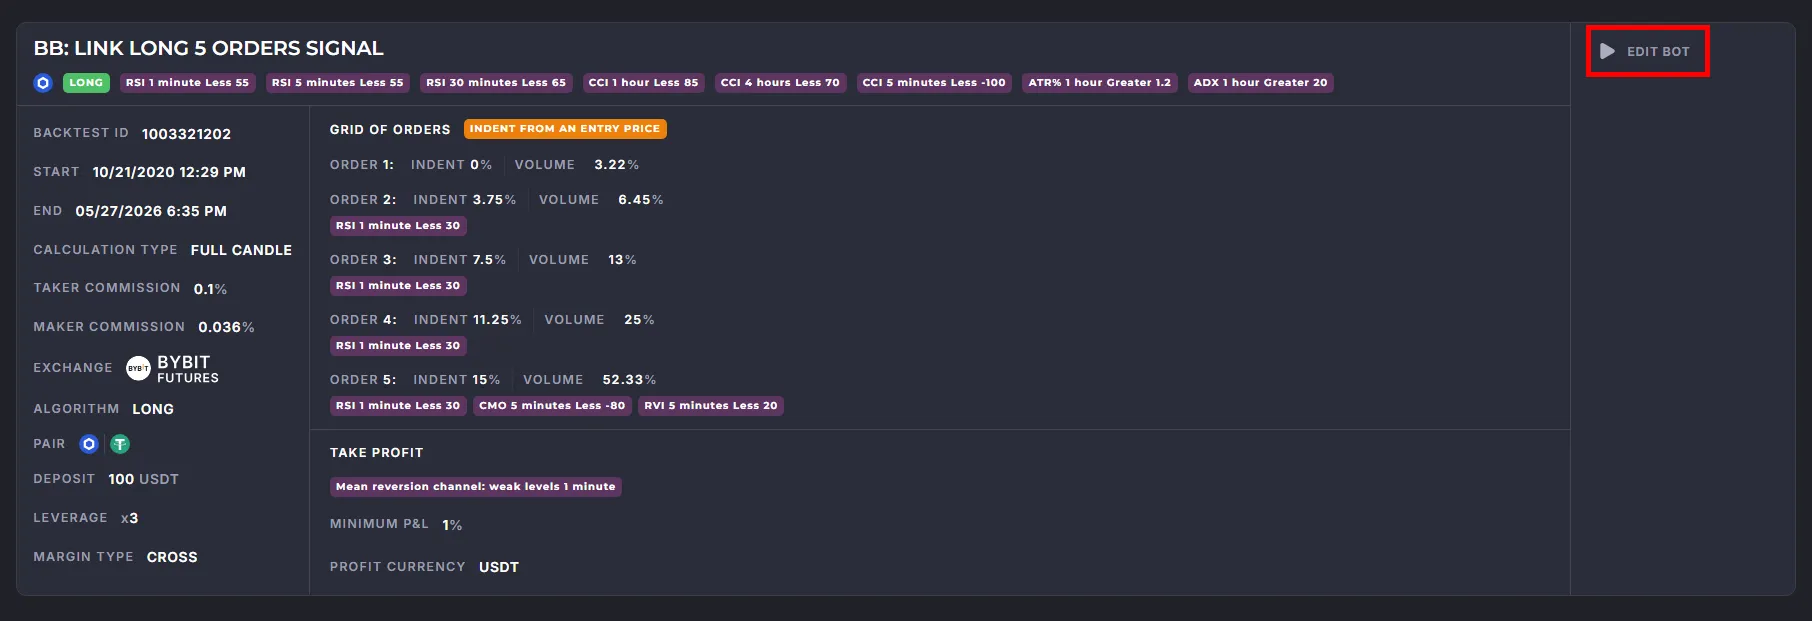
“EDIT BOT” button — transfers the settings to the bot editor: you can continue tuning, test again, or save the bot and launch it on the exchange.
Frequently asked questions
Section titled “Frequently asked questions”1. Which type of backtest do I need?
Section titled “1. Which type of backtest do I need?”- If the strategy uses entirely signal-based orders without strictly fixed indents, a “Candle Body” test is sufficient.
- If the strategy employs a grid of orders, take-profits, or stop-losses in “Simple” or “Own” mode, use the “Full Candle” option (body + wicks) when the distance between orders exceeds 0.5%.
- If the distances to fixed averaging levels, take-profits, or stop-losses are short (less than 0.5%), it is better to run backtests using tick data. A “Full Candle” simulation for such a bot may show significant discrepancies compared to actual trading.
2. Deals are not visible for the entire test period.
Section titled “2. Deals are not visible for the entire test period.”- The coin got listed just recently — there is no data for the whole period.
- The selected exchange has not been connected to us long enough — 1 minute candles may be missing. Try another exchange in the backtests, and trade on the preferred one.
3. The bot opens deals not according to the indicators
Section titled “3. The bot opens deals not according to the indicators”- Check the order creation and execution times, as well as the Indent of the first order and Pulling up parameters (we recommend to use the minimal values). Because the bot may create limit orders according to the signals, but they are executed much later.
- Also remember: Deal opens on the next candle after the signal is triggered.
- If it doesn’t visually match, scroll the candles history to the left (see note above).
4. The MAE is not equal to the drawdown of the deposit
Section titled “4. The MAE is not equal to the drawdown of the deposit”The deposit is the highest amount of funds for the deal, and not the guaranteed volume of the position. Exchange restrictions (minimum order, price step) cause rounding, the total volume of the position differs from the “deposit × leverage”.
5. Deal is marked as “Profit” in the list of deals, but shows dashes instead of numbers
Section titled “5. Deal is marked as “Profit” in the list of deals, but shows dashes instead of numbers”Expand the deal (”+” button) and check the orders. If all orders are cancelled, means the exit was triggered by the indicator signal (and the minimum PnL is not checked here). Technically, it’s a profit, but the mechanics are similar to a Pulling up. Set the Indent = 0 (Market) to avoid this effect.
If the orders were executed, it is possible that the reason is price rounding (too many decimal places) → increase % TP to avoid this effect.
Another option is that the exchange’s commission is debited in the 3rd currency (for example, BNB) — we do not have this data, so these numbers are not reflected in the backtests (and in Statistics also).
6. With the filter “Price > 0” there should be deals every minute, but there are fewer
Section titled “6. With the filter “Price > 0” there should be deals every minute, but there are fewer”The graph draws only the trades of the current list page. Check the sorting order (set it by date). Check the Pulling up — it may cancel some deals. Set Indent = 0 (Market) or increase the % of the Pulling up. Cancelled deals are visible in the list of deals, but not on the chart.
7. Why the %MAE does not correspond to the absolute value, and with partial averages the MAE is greater?
Section titled “7. Why the %MAE does not correspond to the absolute value, and with partial averages the MAE is greater?”MAE as a percentage depends on the average price of the position at each step (executed grid order). MAE as an absolute value (in USDT) depends from the volume that we gained in the deal. We show the maximum of % MAE for all stages and the maximum of absolute MAE next to it (i.e. they may not be from the same deal).
8. There is a deal in the backtest, but no deal in the real trading
Section titled “8. There is a deal in the backtest, but no deal in the real trading”- Check the start and end dates of the backtest. Was the bot launched during the backtest period?
- Check the locks in the profile. Could the bot have been restricted after receiving the signal?
- Write to support: attach a “Share” link to the backtest, Bot ID, date and exact UTC time you want us to check.
9. There is a deal in real trading, but it is not in the backtest.
Section titled “9. There is a deal in real trading, but it is not in the backtest.”- Check the start and end dates of the backtest. The deal might not have been included in the testing period.
- If you use the “Period” display filter in a long backtest, only deals that ended within the period will be visible. Entries and orders of unclosed trades are not shown.
10. Why do the same settings with different deposits result in a different number of deals?
Section titled “10. Why do the same settings with different deposits result in a different number of deals?”Different deal volumes allow for different averaging — where the bot was able to add more volume to the grid order within the allocated deposit, the average price dropped lower and the deal exit could be triggered earlier. Then, while the bot with a small deposit is still running the first deal, the bot with a large deposit can already start a new one.
11. Why did the deal entry occur in the backtest, but the deal was canceled, while in real life it continued?
Section titled “11. Why did the deal entry occur in the backtest, but the deal was canceled, while in real life it continued?”This is a simulation feature. In the backtest, if the take profit conditions are met before the first order is executed, the orders are canceled. In real life, this doesn’t happen; the bot waits for the orders to be executed. We recommend using configurations with a Market entry (with a zero first order indent).
12. How to reduce the MAE?
Section titled “12. How to reduce the MAE?”- Strengthen trade entry filters – use higher timeframes and more conservative values for comparison.
- Increase the grid overlap width (in the “Simple” trading mode).
- Use adaptive averaging (the “Signal” trading mode). Also, ensure that the indents between orders are not too small.
- Use a logarithmic distribution less than 1 (in the “Simple” trading mode), or similarly adjust the indents in other modes.
- Use a high Martingale (increase the volume from order to order).
Mini glossary (for quick answers)
Section titled “Mini glossary (for quick answers)”- Gross — total result without deduction of commissions.
- Net — the result, taking into account trading commissions (we look at this value first of all).
- MFE — Maximum Favorable Excursion of the deal/backtest.
- MAE — Maximum Adverse Excursion, deepest drawdown; the key to assessing the risk of liquidation.
- Wick (shadow) — the extreme of the candle.
- Pulling up — cancellation of the deal where no orders were executed because the price has gone too far.