When your bot opens a deal, it places its orders on the exchange.
At the same time, a corresponding card appears in the “Active deals” section of the site (https://veles.finance/cabinet/deals).
Important!
Please do not confuse the deal’s card with another card – the actual bot card on the main page.
More information about bot card please read here:
https://help.veles.finance/en/bot-card/
Note.
If you see “Active deals (0)” on this page, but some bots have actually active deals, please check if one of the coins has been delisted on the exchange. Inform our Support Service about this situation, please
https://help.veles.finance/en/feedback/
The card can be in a collapsed or expanded state. Use the “Down” button in the right corner to expand the card.

The expanded card looks like this:

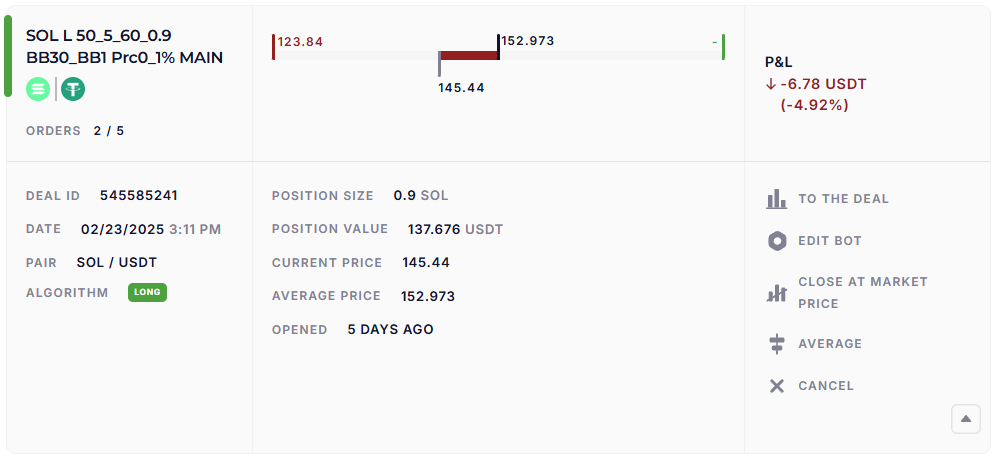
On the TOP LEFT is the name of the bot, the icons of the trading pair (SOL/ USDT), the number of orders executed at the moment, and their total number in the grid (2 out of 5).
On the BOTTOM LEFT are indicated:
– deal number (ID 545585241), it is unique for each deal,
– date and time when the deal was opened (placing orders),
– the trading pair,
– bot algorithm (Long or Short).
At the CENTER TOP you can see the price line.
Number in the center above the line is the current “Average price” of a position (on Futures) or the purchase/sale of a coin (on a Spot).
Number on the left above the line is the price of either the nearest grid order or a Stop Loss (if it is set in the bot). If there is a dash here, then either all orders are executed and the bot is in invest state, or the price of the order is unknown (if the bot averages according to indicator signals).
Number on the right above the line is the price of the nearest Take Profit order, if it is a limit one. In case of exit by the indicator signal, the Take Profit price can not be known in advance and therefore a dash will be displayed here.
Number under the line is the current price of the coin. The line itself can be red or green – it depends on the PnL in the deal.
In the CENTER BELOW the ruler are indicated:
– the current volume of the deal in the base currency,
– the current deal volume in the quote currency (nominal),
– the current price of the asset on the exchange,
– the average price of the asset in the deal,
– how long has the deal been open.
On the TOP RIGHT of the card you can see the current PnL of the deal (“Profit-and-Loss”), in absolute value and as a percentage of the price movement.
On the BOTTOM RIGHT are the deal control buttons:
– “To the deal” button opens a new separate page with a chart of the deal and a list of its orders,
– the “Edit bot” button opens the bot editor,
– the “Close at market price” button will open the dialog window where you can close your deal immediately,
– the “Average” button opens a dialog for adding an extra averaging order to the deal (this button disappears if at least one Take Profit was executed in the deal),
– the “Cancel” button is used to cancel the bot’s deal. If you click and confirm, the bot cancels all its orders that have not been executed by this moment and switches to the “Terminated” status. After that, the user must complete the bot’s deal on the exchange manually.
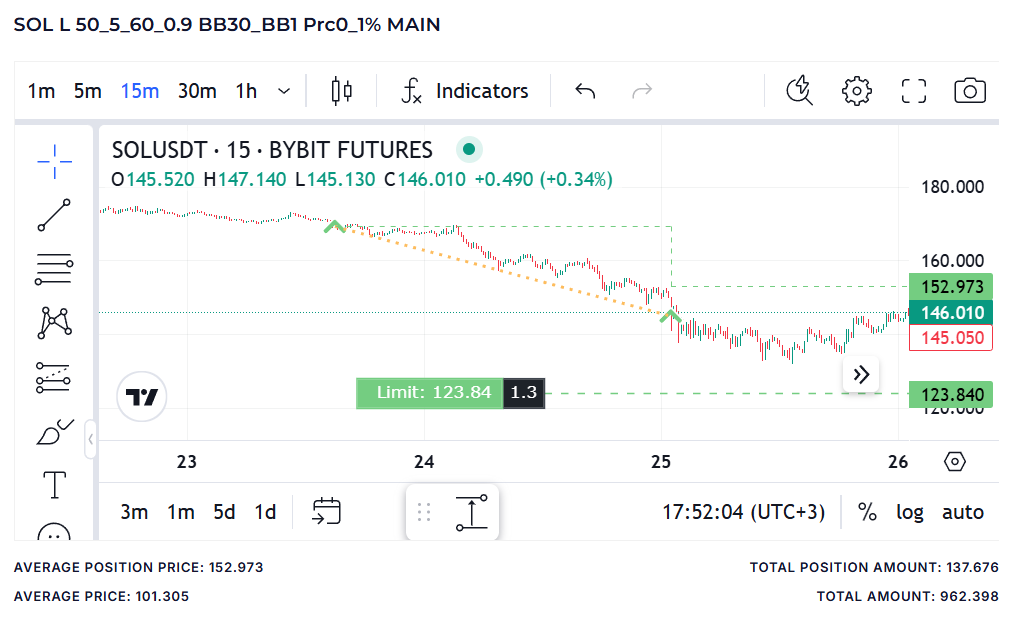
The DEAL CHART (opens on a new page) shows the positioning and execution of orders on the coin chart.
If the grid orders in this bot are placed by the signals of the indicators, then their execution price is unknown in advance, and they will not be displayed on the chart.

Below the chart you can see the following:
“Average position price” – current Average position price
“Average price” – Average position price after execution of all orders
“Total position amount” – current deal volume
“Total amount” – deal volume after execution of all grid orders.
Please note: the total volume of the deal is the sum of the volumes of executed orders in both directions – opening and closing. That is, it will be equal to double the “Total Amount”.
The red dashed line is the price of the coin at the time the chart opens (it does not update automatically).
The “green arrow” marks are the points where the bot’s purchase orders were triggered (in this case, the purchase of a coin took place, the bot in the Long algorithm).
The “red arrow” marks are the points where the bot’s sell orders were triggered (if the bot is in the Short algorithm, or the Take Profit orders from the Long-bot).
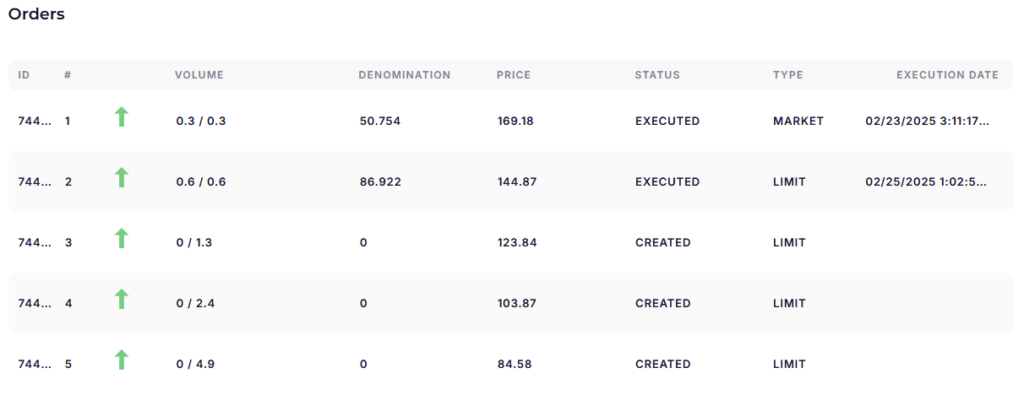
In the list of orders under the chart, these orders have the status “Executed”.
The marks of orders related to the same deal are connected by a yellow dotted line.
The green dashed line with steps is the average price of the position. Each step represents the averaging. The position price is approaching the current price at the time of execution of the grid order. How successfully the price is averaged in the bot is determined by the “% Martingale” setting – the higher the percentage, the closer the profit point is.
Limit orders scheduled in the bot are displayed on the coin chart indicating the price and volume. The market orders that the bot will place when their conditions are fulfilled cannot be displayed in advance.
If an order is placed on the exchange, but has not yet been executed, such an order will have the status “Created” in the list of orders under the chart.
An order that is scheduled but has not yet been placed on the exchange will have the status “Pending” in the list.
Sometimes it is possible that the exchange cancels the order (Stop Loss), but the bot does not stop with an error. Such an order has the status “Liquidated” in the list. It is necessary to check the history of trading on the exchange and find out which intervention caused the cancellation.
In this example, only averaging orders (with green arrows) are visible in the list, and the take profit order in this bot will be a market order (bot will close the deal by the indicator signal), so it is not yet available.

Note. The type of order shown in this table is exactly the one that was planned by the bot. But in fact, a limit order may be executed on the exchange as a market order – if the indent was too small and the price moved too quickly. You will see this discrepancy in the trading history on the exchange (see an example in our article: https://help.veles.finance/en/exchange-transaction-fees/).


