What are MFI levels?
The MFI indicator has levels, indicating the oversold (values below 20) and overbought (values above 80) state of the coin.
Read more about the MFI indicator in our article:
https://help.veles.finance/en/what-is-mfi/
Crossing an indicator level is an important signal because MFI assesses the flow of money in the market and can indicate a coming change in trend.
This indicator measures trading volume relative to price changes, showing how actively money is entering and exiting the market. When the MFI value crosses a certain level, it may indicate that the asset is overbought or oversold and may be reversing.
It is important to remember that an MFI cross does not guarantee a trend change. For more accurate decisions traders usually use additional indicators and analysis of the current market situation.
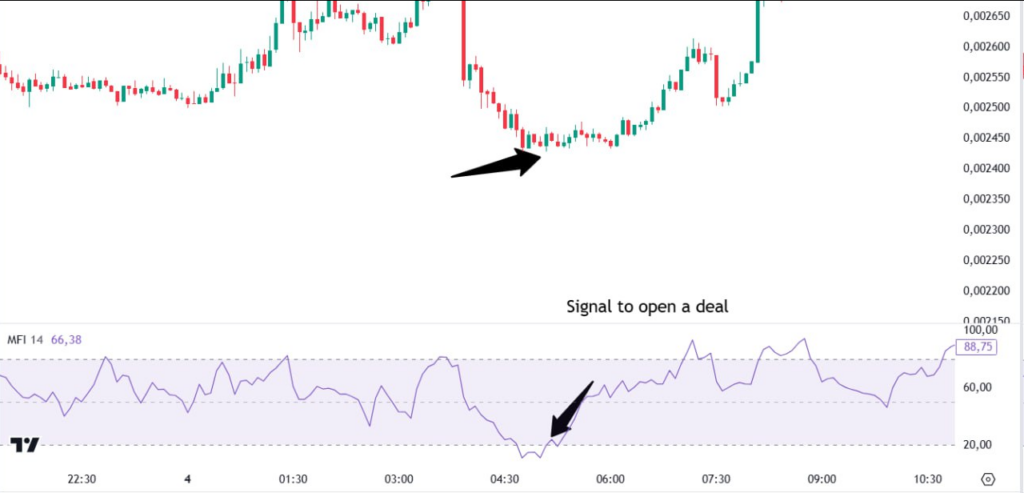
Example of a signal to open a Long-deal (or to close a Short):

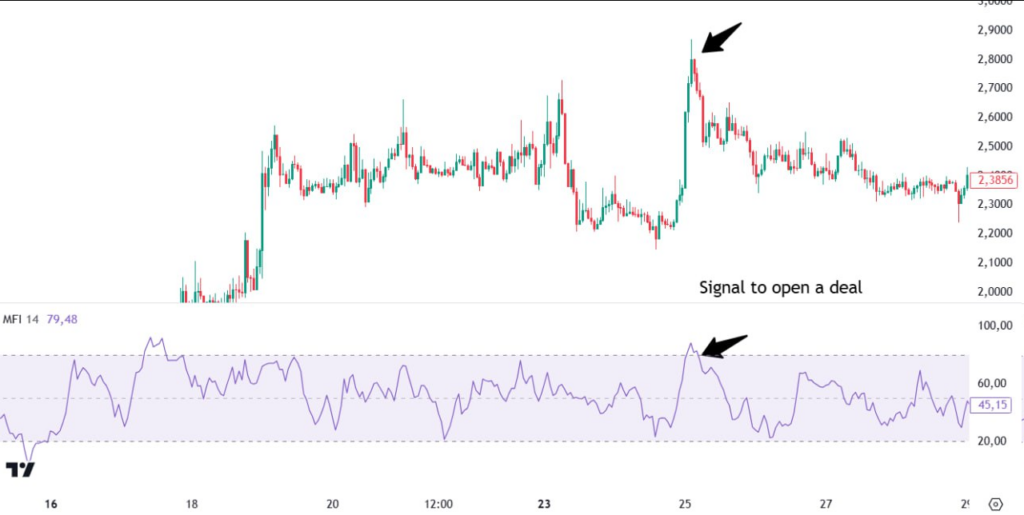
Example of a signal to open a Short-deal (or to close a Long):

How to apply it to trading?
The algorithm looks for indicator levels above 80 for possible sales and below 20 for purchases, assuming a possible price reversal. A position is entered when the indicator value returns to the price balance range (the moment of the reverse crossover).
What is the MFI mid-range intersection?
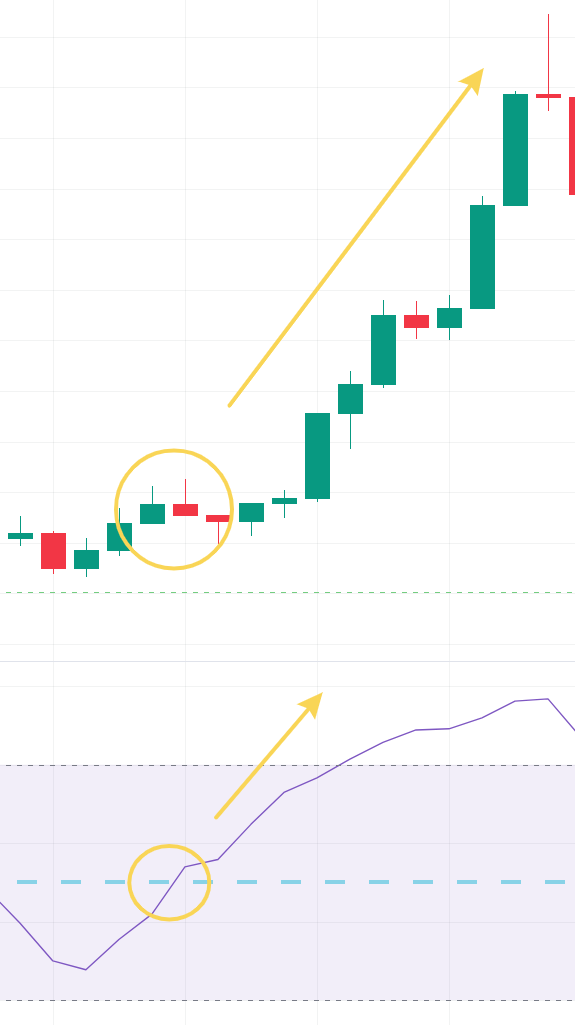
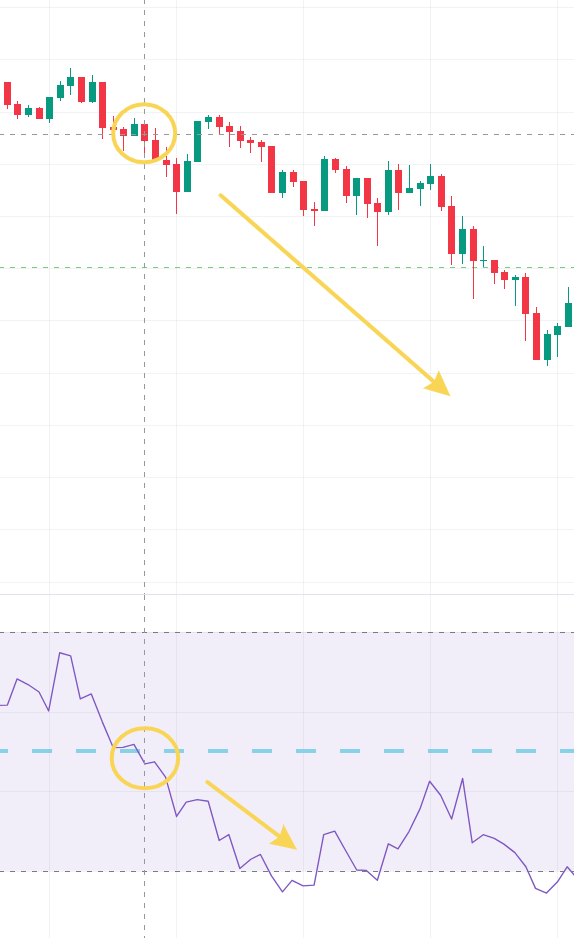
Crossing the 50 level according to the MFI indicator can serve as an additional signal.
If we add a line at the level of 50 to the MFI chart, then the intersection of the level from bottom to top indicates increasing buyers pressure and is a signal to open Long.

Crossing the line from top to bottom, on the contrary, shows that sellers are gaining strength, and Short positions are now a priority.

The MFI indicator is used in combination with other indicators, such as RSI or MACD, to improve signal accuracy and reduce the number of false signals.


