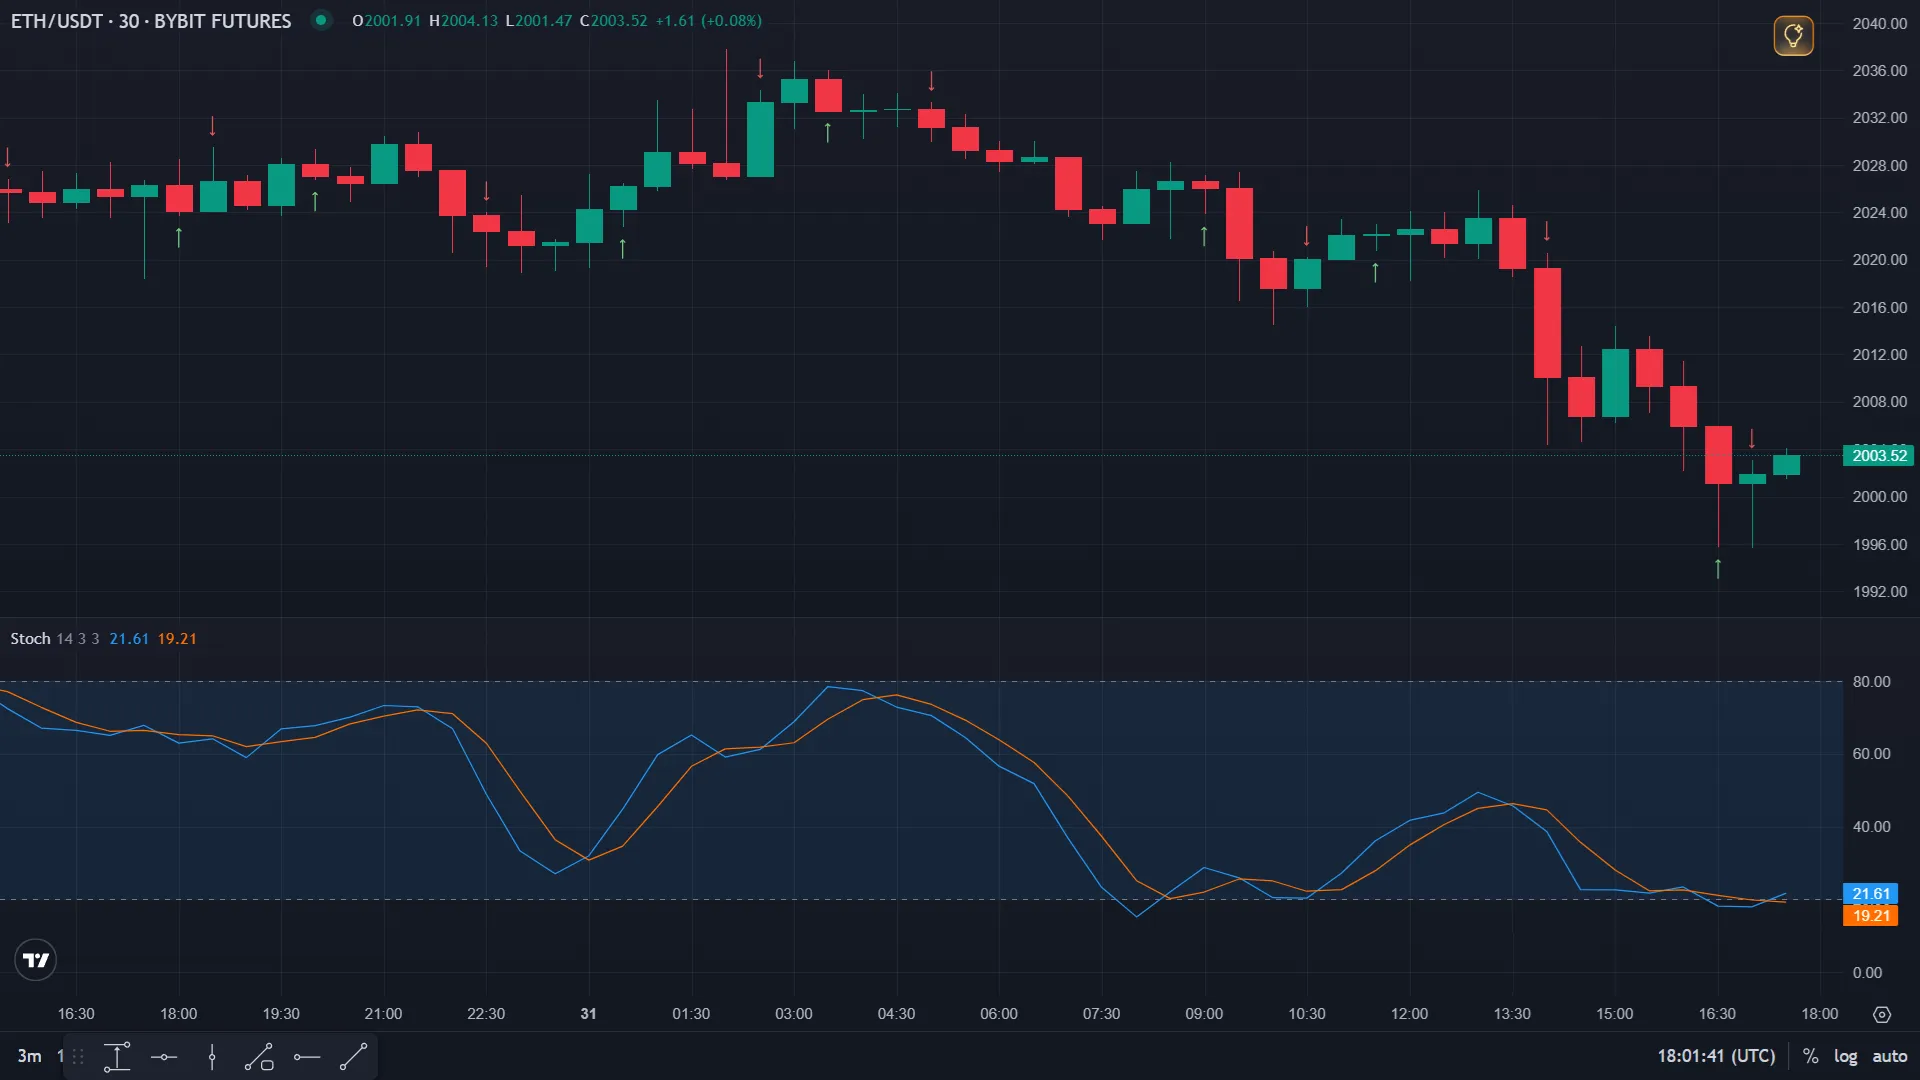
Stochastic
The Stochastic Oscillator is a popular oscillator that evaluates the current closing price relative to the price range for a selected period. It shows the speed and direction of price change, helps identify overbought/oversold zones, and signals reversals.
The indicator consists of two lines:
- %K (Fast Line) — the current price position relative to the range for the selected period.
- %D (Slow Line) — a Moving Average of %K, which smooths out fluctuations.
The Veles platform offers two types of stochastics: fast and slow.
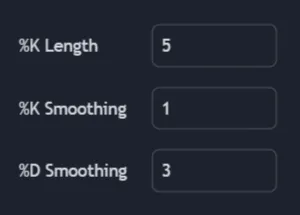
Fast Stochastic
Section titled “Fast Stochastic”- Uses 5 periods to calculate %K.
- Very sensitive to price changes.
- Provides more signals, but also more “noise”.
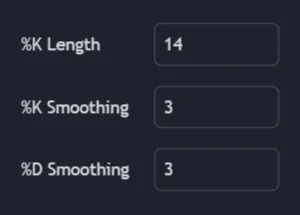
Slow Stochastic
Section titled “Slow Stochastic”- Calculates %K based on 14 periods.
- Additionally smooths out fluctuations using a Moving Average.
- Less prone to false signals and suitable for longer-term trading.
Stochastic Filters in Veles
Section titled “Stochastic Filters in Veles”Two filter types are available for each stochastic:
1. Line Crossover
Section titled “1. Line Crossover”- K crosses D from top to bottom → Sell-signal (open Short or close Long).
- K crosses D from bottom to top → Buy-signal (open Long or close Short).
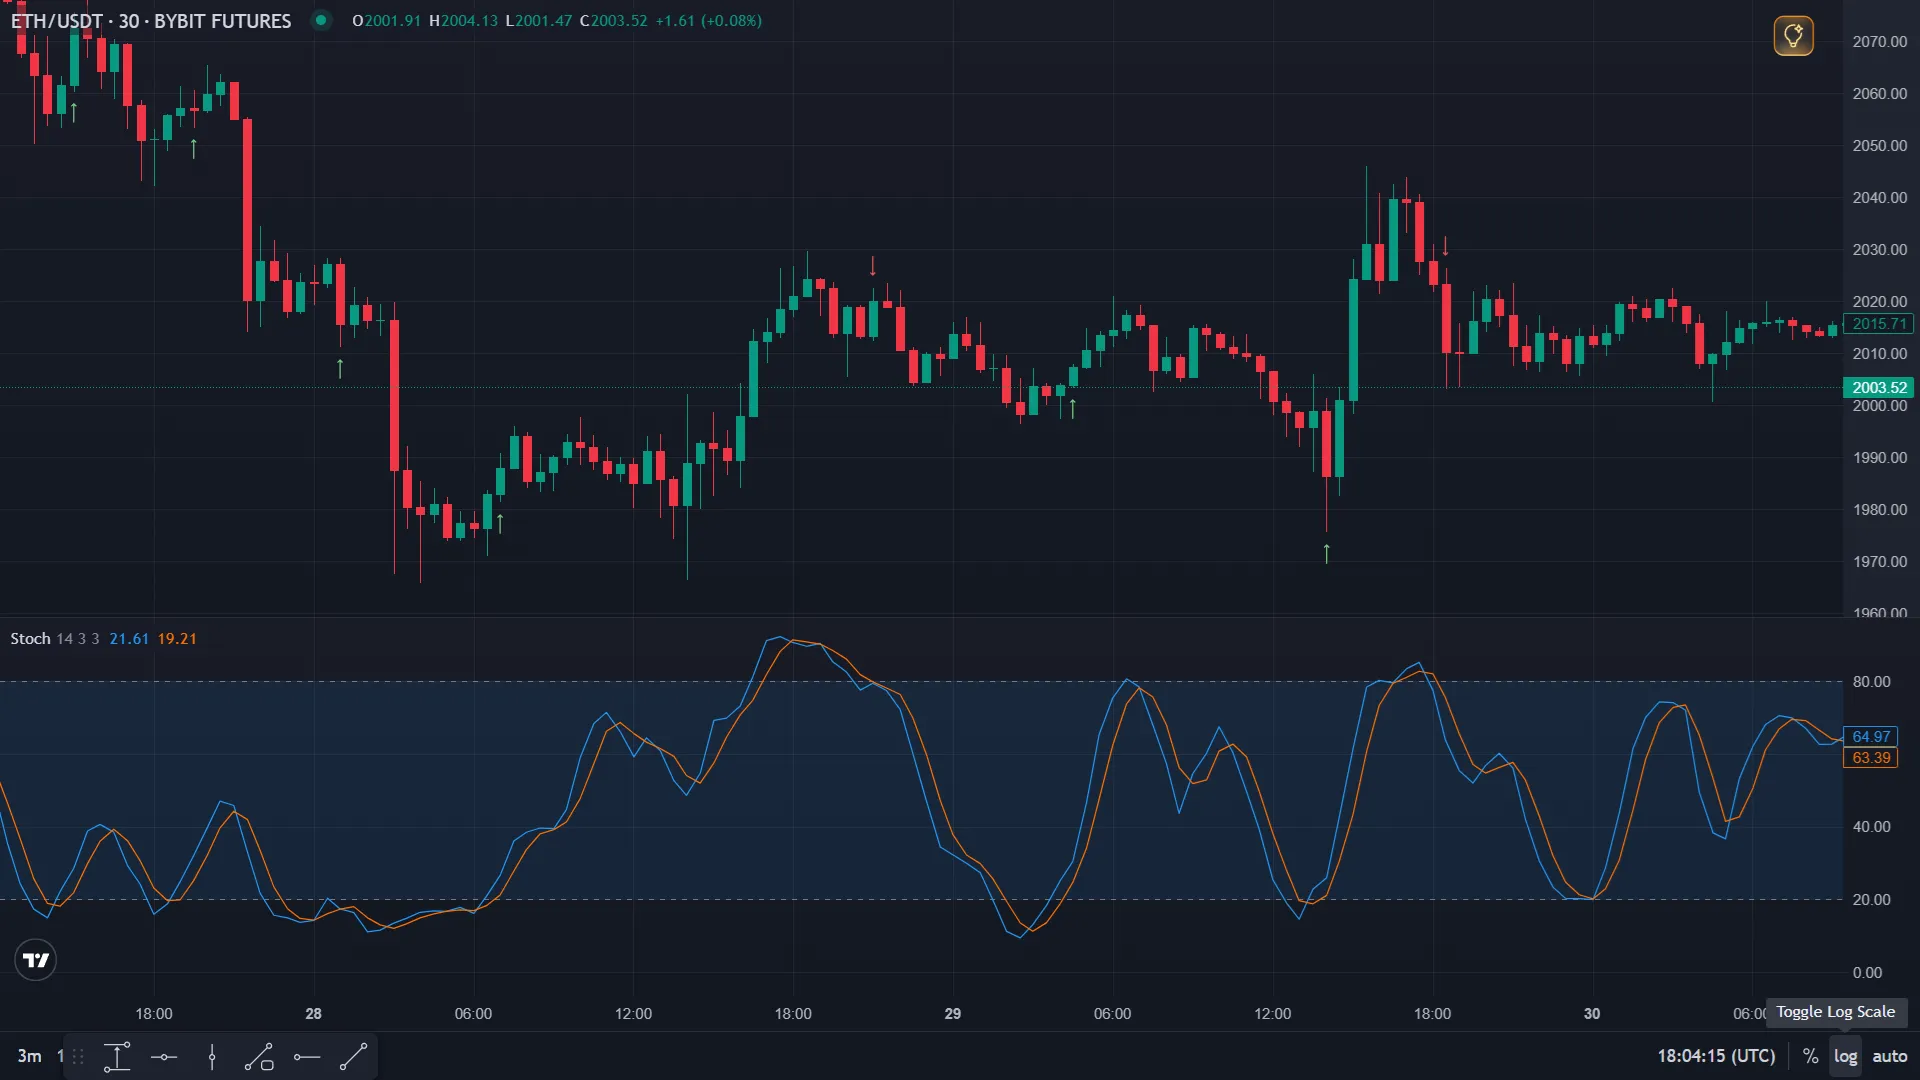
2. Overbought and Oversold Levels
Section titled “2. Overbought and Oversold Levels”- Both lines crossing level 20 from bottom to top → Buy signal (open Long or close Short).
- Both lines crossing level 80 from top to bottom → Sell signal (open Short or close Long).
How to use Stochastic
Section titled “How to use Stochastic”- Trend entry — use K and D crossover signals in the direction of the main trend.
- Signal filtering — combine Stochastic with other indicators (RSI, MACD, SMA, EMA).
- Timeframe selection — on shorter timeframes, Stochastic generates many signals, while on higher timeframes signals are more reliable.
Limitations
Section titled “Limitations”- Stochastic often gives false signals during periods of low volatility.
- Can hang in overbought or oversold zones for a long time.
- Works best in sideways movements and when trading from support/resistance levels.
⚠ Before using the indicator, we recommend backtesting its settings to ensure the strategy suits your trading style.
Using in Veles Bots (Flexible Indicator)
Section titled “Using in Veles Bots (Flexible Indicator)”Two variants are available: Stochastic (%K) and Stochastic (%D).
Available settings:
- Period - the number of candles for %K calculation. Range: 3–100, default 14.
- SmoothK - the smoothing period for the %K line. Range: 1–50, default 1.
- SmoothD - the smoothing period for the %D line (available for %D variant only). Range: 1–50, default 3.
- Interval - the candle timeframe.
- Method - the calculation type. By bar close (only on the selected interval) or by minute (once per minute for any interval).
- Shift - shifts the requested indicator value back by the specified number of candles.
Summary
Section titled “Summary”The Stochastic Oscillator is a proven tool for identifying momentum shifts and overbought/oversold extremes. In Veles bots, both the Fast and Slow variants are available — Fast for more frequent signals on lower timeframes, Slow for more reliable signals on higher ones. Combine with trend filters to reduce false entries during strong directional moves.