Moving Average Convergence Divergence (MACD)
MACD (Moving Average Convergence/Divergence) is one of the most popular technical analysis indicators. It is used to determine the strength and direction of a trend, as well as potential reversal points.
How the MACD Is Calculated
Section titled “How the MACD Is Calculated”- MACD Line = EMA(12) − EMA(26)
- Signal Line = EMA(9) of the MACD Line
- Histogram = the difference between the MACD Line and the Signal Line
Thus, the MACD combines the properties of both a trend indicator (Moving Averages) and an oscillator (a histogram of fluctuations around zero).
MACD Signals
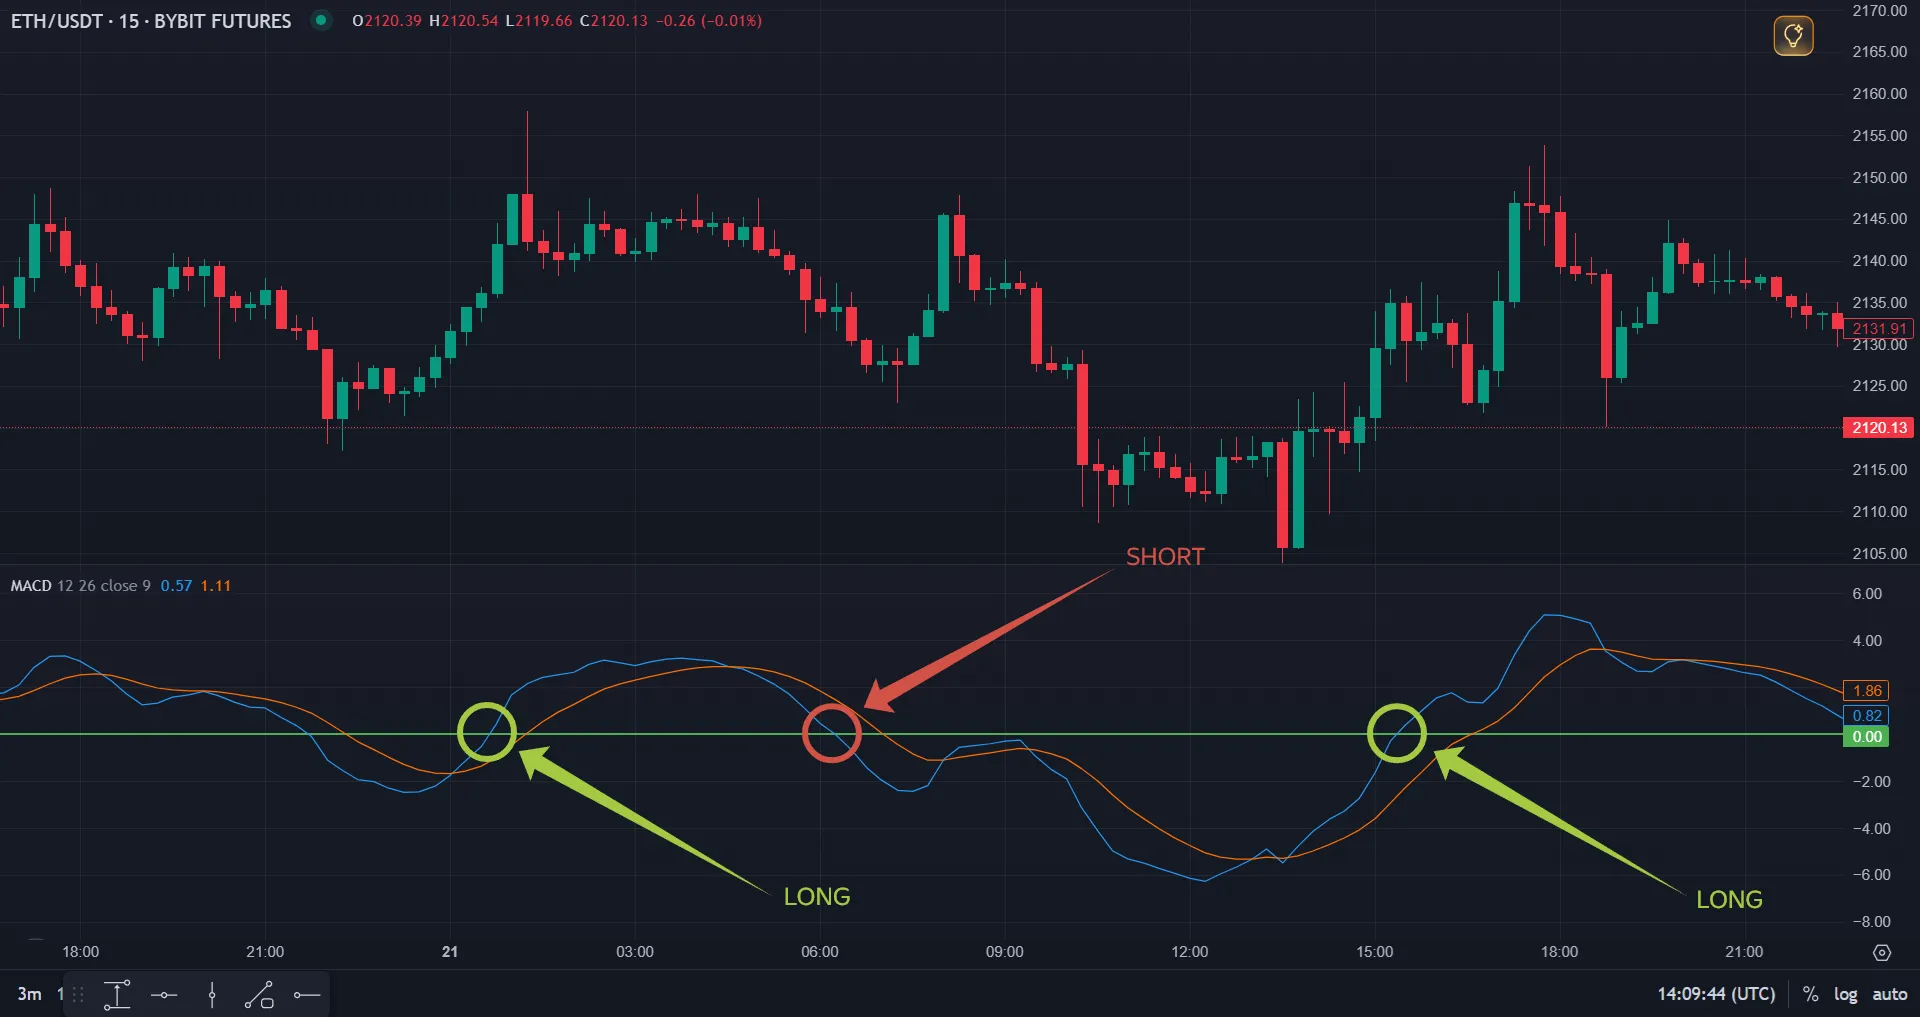
Section titled “MACD Signals”1. Zero Line Crossover
Section titled “1. Zero Line Crossover”- MACD crosses zero from below to above → signal to open a Long deal.
- MACD crosses zero from above to below → signal to open a Short deal.
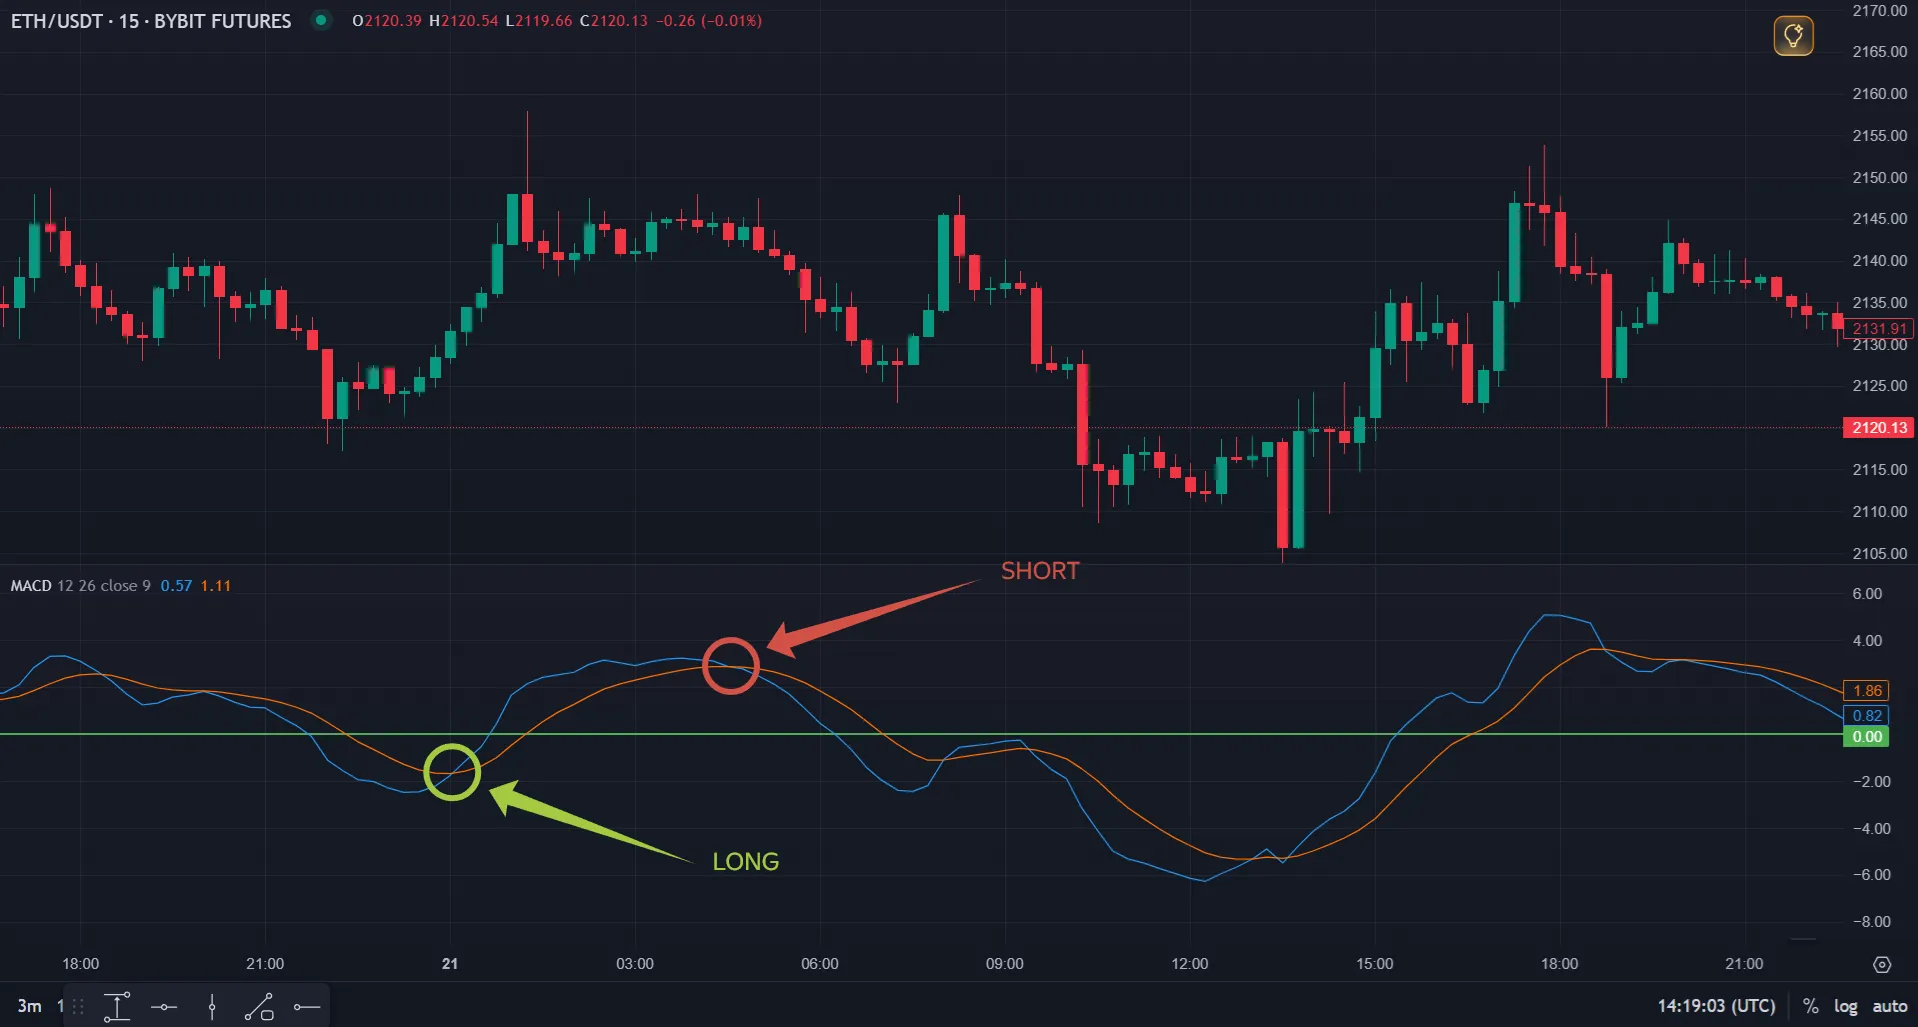
2. MACD and Signal Line Crossover
Section titled “2. MACD and Signal Line Crossover”- MACD crosses the signal line from bottom to top → Buy-signal (open Long).
- MACD crosses the signal line from top to bottom → Sell-signal (open Short).
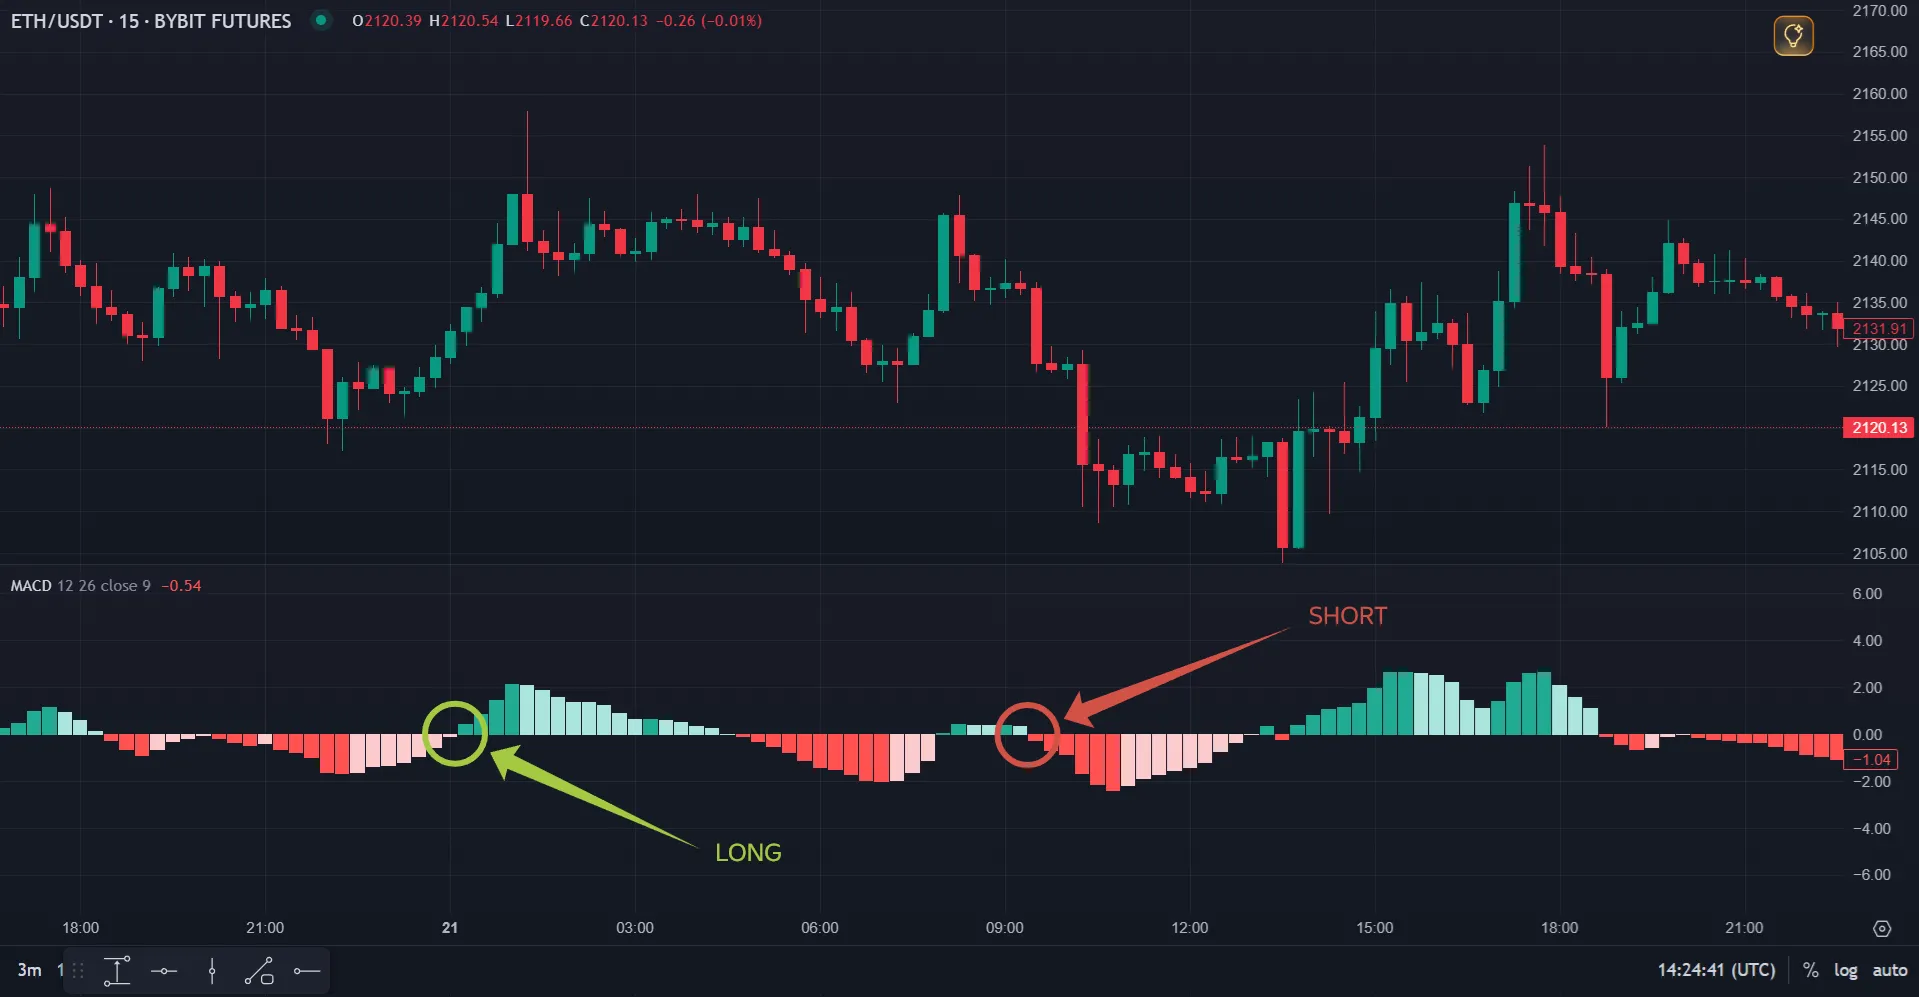
3. Histogram Trend Change
Section titled “3. Histogram Trend Change”- The histogram changes from negative to positive → Buy-signal (open Long).
- The histogram changes from positive to negative → Sell-signal (open Short).
MACD in Veles Bots
Section titled “MACD in Veles Bots”- The “MACD Histogram Trend” indicator provides a signal as long as a specific trend persists (as long as the histogram bars are the same color):
- Histogram is in the green zone → Buy-signal (open Long).
- Histogram is in the red zone → Sell-signal (open Short).
- The “Reverse Signal” option is available for the MACD — you can use standard Long-signals to open or to average a Short deal (and vice versa).
- The higher the timeframe, the more reliable the signals, as shorter timeframes result in more market noise.
Limitations
Section titled “Limitations”- MACD is a lagging indicator, meaning signals are generated only after a movement has already begun.
- On a flat market, the MACD can generate many false signals.
- For increased accuracy, it’s best used in combination with RSI, support/resistance levels, or volume filters.
Using in Veles Bots (Flexible Indicator)
Section titled “Using in Veles Bots (Flexible Indicator)”The indicator is available as three arguments, each of which can be used to set conditions:
- MACD - MACD line.
- MACD (Signal) - signal line.
- MACD (Trend) - the difference between the MACD line and the signal line (histogram).
Available settings:
- FastLength - the length of the fast EMA used in the formula. Range: 2–500, default 12.
- SlowLength - the length of the slow EMA used in the formula. Range: 10–500, default 26.
- Period - the length of the signal EMA used in the formula. Range: 2–500, default 9 (for MACD Signal and MACD Trend).
- Interval - the candle timeframe.
- Method - the calculation type. By bar close (only on the selected interval) or by minute (once per minute for any interval).
- Shift - shifts the requested indicator value back by the specified number of candles.
Summary
Section titled “Summary”MACD is one of the most versatile indicators available — combining trend detection with momentum measurement in a single tool. In Veles bots, the MACD Histogram Trend filter provides clean directional signals that work especially well on higher timeframes and in combination with volume or RSI filters.