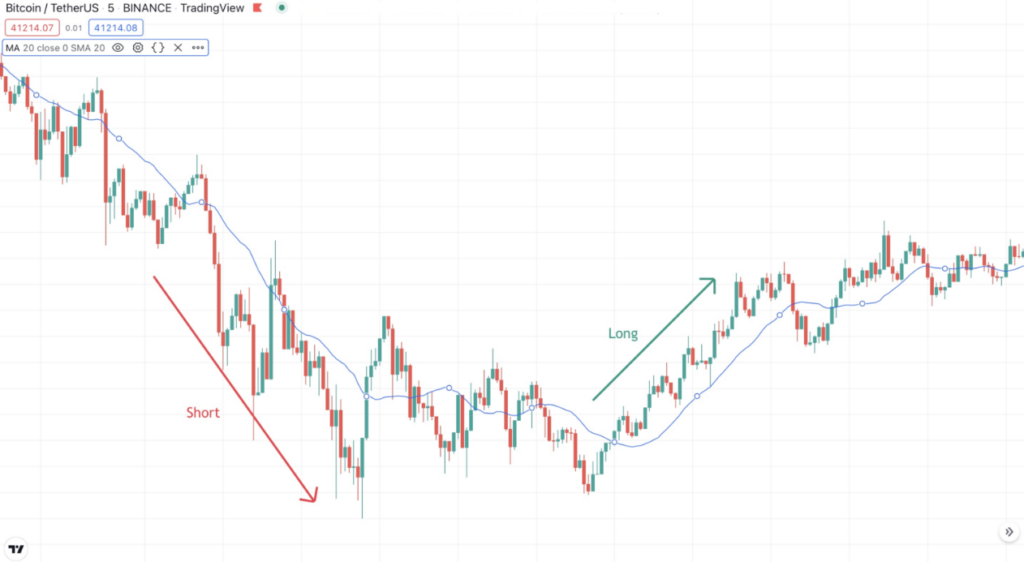
Moving Average (sometimes also named Simple Moving Average) is the average price value for a specific period of time.
With the help of this indicator you can understand the direction of the trend in the market. If the chart line is above the moving average, it means that the market is “bullish” and you can buy the asset. If it is lower, then the market is “bearish” and in this case it is preferable to sell.
Various calculation formulas are used to calculate the moving average. In this case we take the formula of Simple Moving Average (SMA) and Exponential Moving Average (EMA).

SMA and EMA are very different.
The SMA line reacts much slower to price changes and is suitable for long positions.
Late dates are more important for EMA calculation. The moving average EMA reacts faster and is more suitable for short trading.
In the Veles platform, you can set conditions on the moving average value, allowing the bot to trade on specific signals.


