Bollinger Bands
Bollinger Bands is one of the most well-known technical analysis indicators, developed by John Bollinger. It helps traders measure volatility and identify potential overbought and oversold levels of an asset.
How Bollinger Bands Work
Section titled “How Bollinger Bands Work”Bollinger Bands consist of three lines:
- Middle Band — Simple Moving Average (SMA) for the selected period.
- Upper Band — SMA + k standard deviations (usually k = 2).
- Lower Band — SMA − k standard deviations.
How it works:
When the bands widen, the indicator shows increasing volatility, and when they narrow, it shows a decrease in market activity.
The Veles bot implementation uses a standard deviation of 2 and the ability to work on different timeframes, from 1 minute and higher. A “Reverse Signal” option is also available, for switching the entry and exit logic.
Bollinger Band Trading Signals
Section titled “Bollinger Band Trading Signals”- Candles closing below the lower band is a Buy-signal (open Long or close Short).
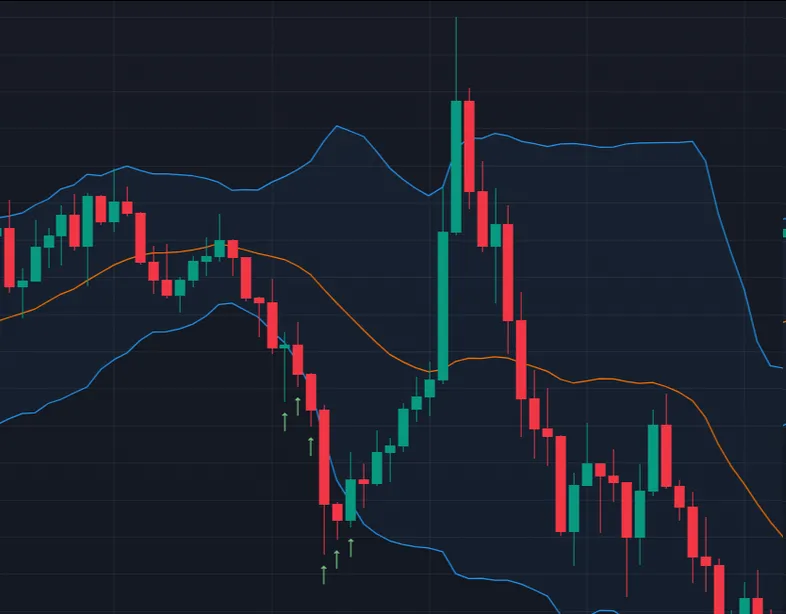
- Candles closing above the upper band is a Sell-signal (open Short or close Long).
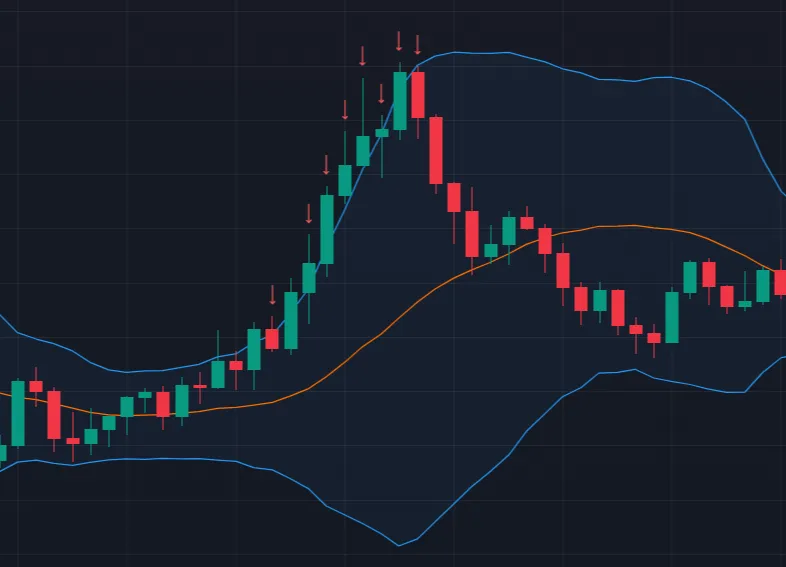
This approach can be used for both trend trading (for a breakout) and counter-trend trading (for a rebound from the channel boundaries).
Advantages
Section titled “Advantages”- Shows the current market status: trend or flat.
- Helps find entry and exit points with high accuracy.
- Universal – works in all markets (cryptocurrencies, stocks, forex).
- Can be combined with other indicators to filter signals.
Limitations
Section titled “Limitations”- In a strong trend, the price may remain outside the bands for a long time, giving false signals for a rebound.
- It is recommended to adjust the period and standard deviation multiplier for each instrument.
- Works best when combined with volume or trend filters.
Using in Veles Bots (Standard Indicator)
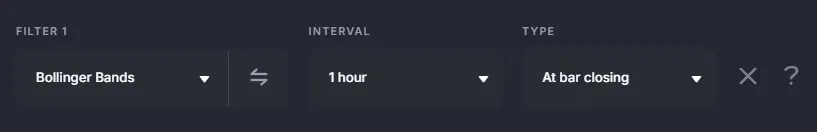
Section titled “Using in Veles Bots (Standard Indicator)”When trading with Bollinger Bands in the bot, you can set the following:
- Calculation timeframe (1 minute or higher).
- Trading direction (breakout or rebound).
- “Reverse signal” option to change the entry logic.
- Minimum PnL check to prevent closing deals at a loss.
Using Veles in Bots (Flexible Indicator)
Section titled “Using Veles in Bots (Flexible Indicator)”Bollinger Bands are divided into three argument options:
Lower Band - lower band, simple moving average minus K standard deviations, Middle Band - middle band (simple moving average), Upper Band - upper band, simple moving average plus K standard deviations.
You can set your own conditions for any of the bands.
Customizable indicator parameters:
- Period - number of candles for calculation. Range: 5–100, default 20.
- K - coefficient for determining the band width (number of standard deviations). Range: 0.5–4.0, default 2. This parameter affects only the upper band and lower band).
- Interval - candlestick timeframe.
- Method - calculation type. At bar close (once per selected interval) or per minute (once per minute for any interval).
- Shift - shifts the requested indicator value back by the specified number of candles.
Bollinger Bands Width (BBW)
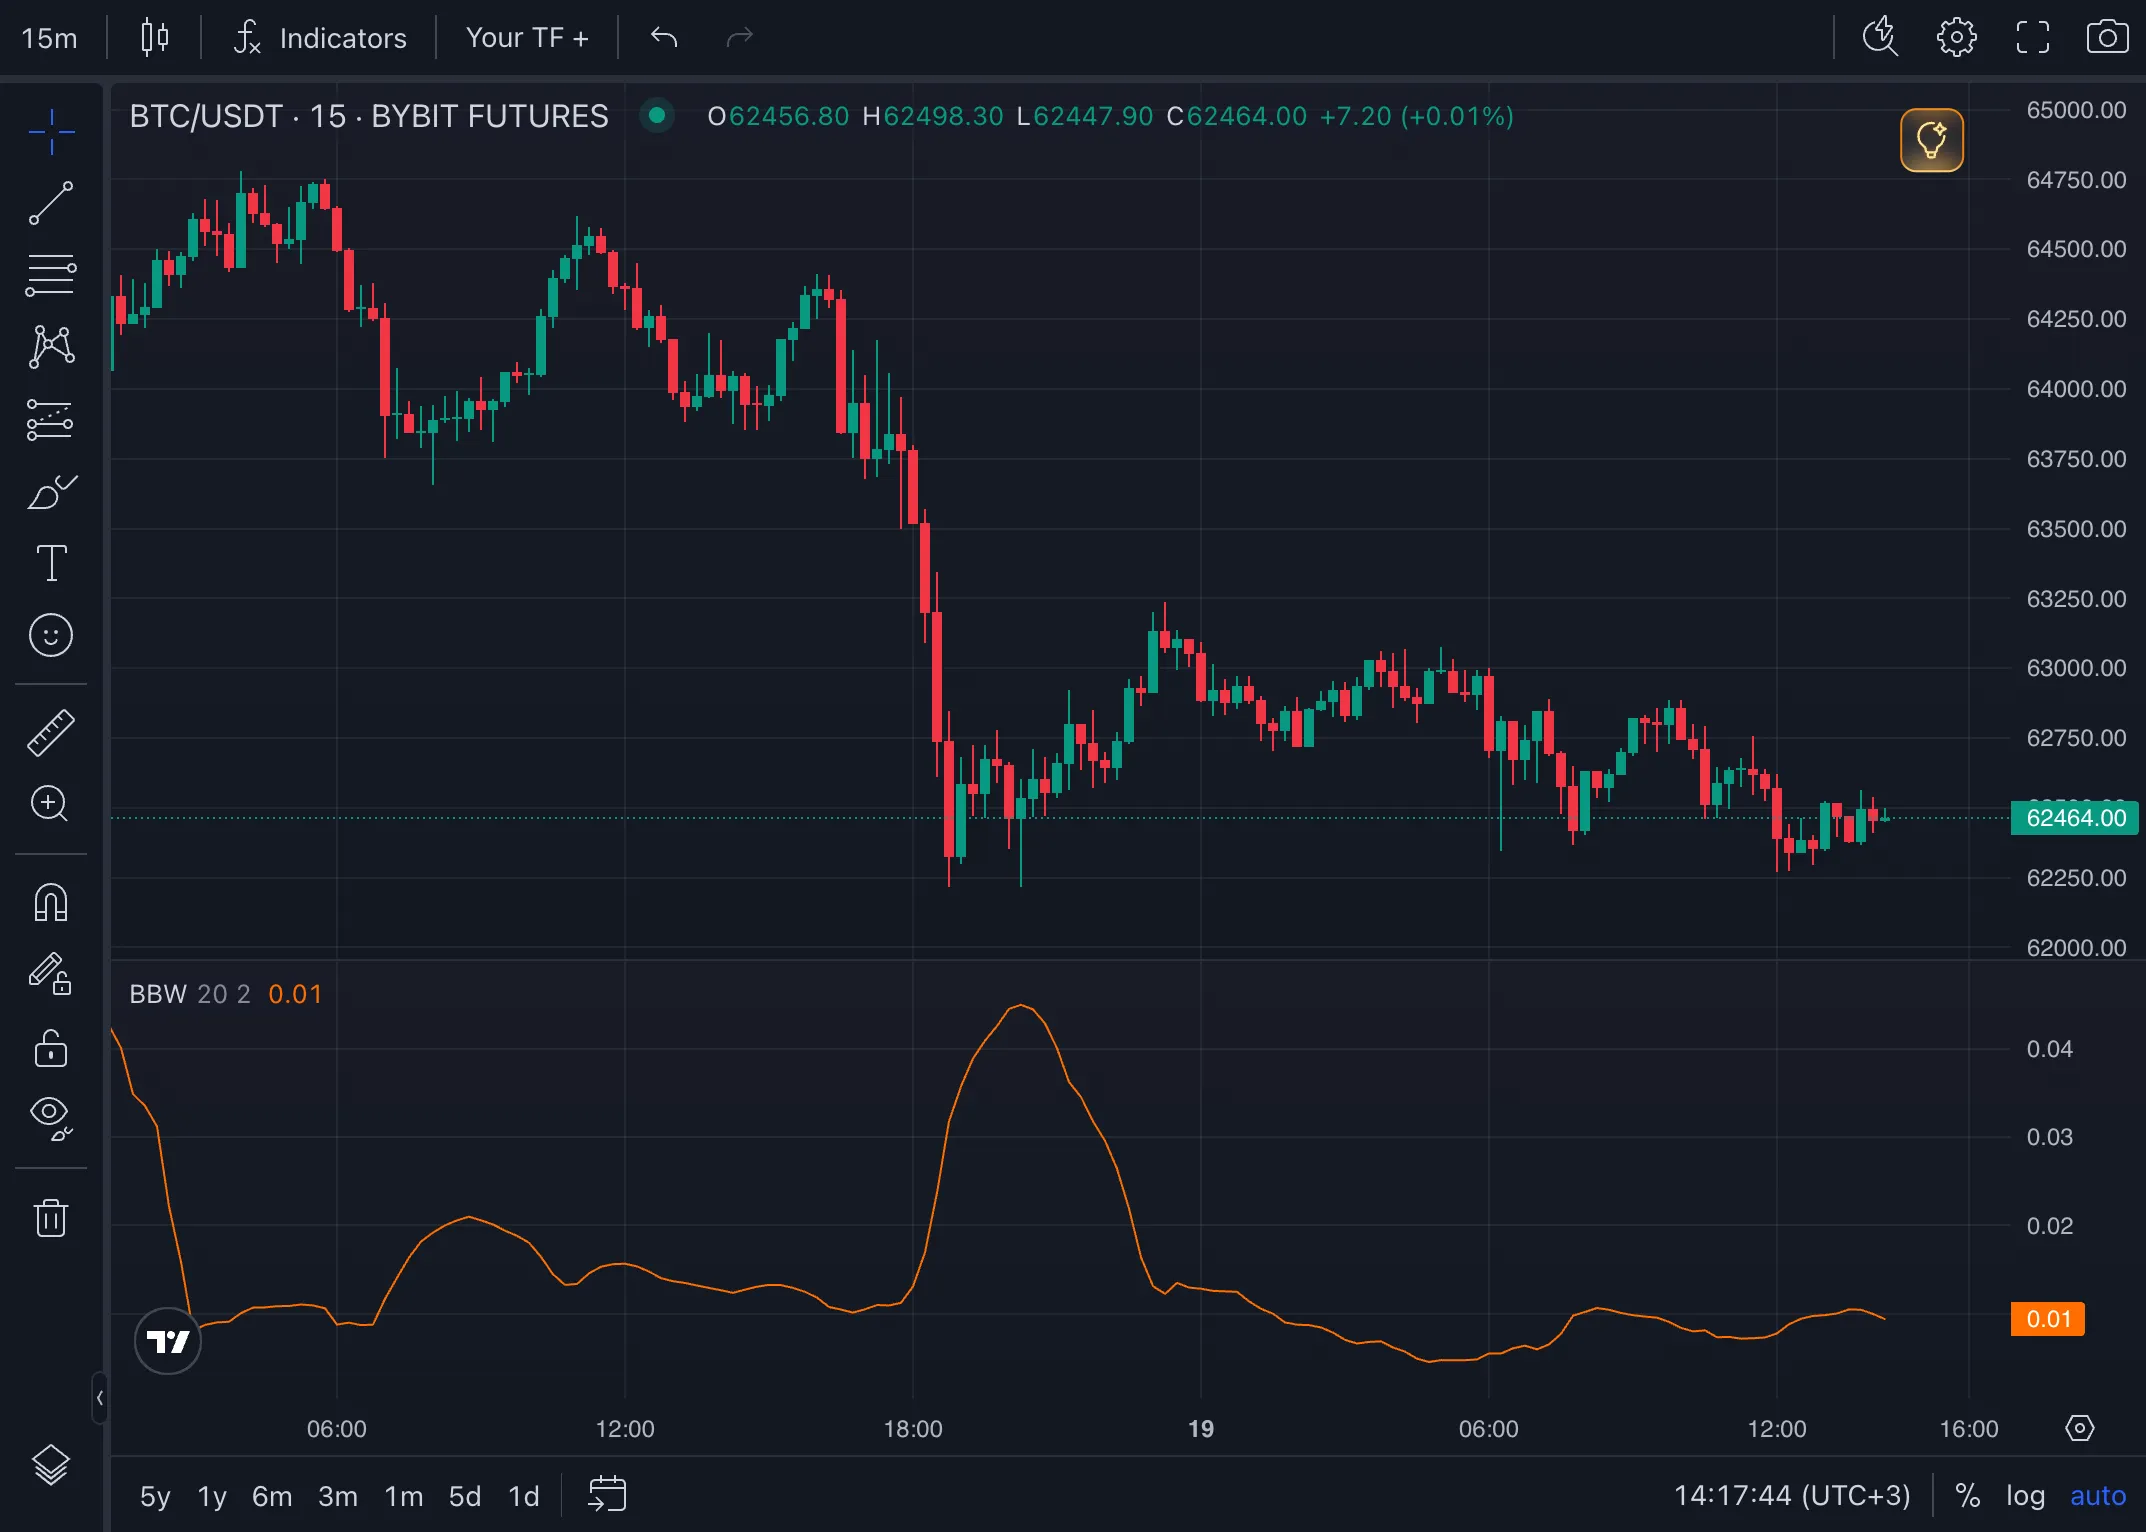
Section titled “Bollinger Bands Width (BBW)”Bollinger Bands Width (BBW) is a derived indicator that measures the distance between the Upper and Lower Bands relative to the Middle Band. It is available as a standalone filter in the conditions selector.
Formula
Section titled “Formula”BBW = (Upper Band − Lower Band) / Middle Band × 100
The result is expressed as a percentage and reflects the relative width of the channel.
How BBW Works
Section titled “How BBW Works”- When volatility rises — bands widen and the BBW value increases.
- When the market quiets down — bands narrow and the BBW value falls.
- An extremely low BBW value (“The Squeeze”) often precedes a sharp price move.
- After a squeeze, price typically breaks through one of the bands and a directional trend begins.
Configurable Parameters
Section titled “Configurable Parameters”- Length — number of candles used to calculate the SMA. Range: 5–100, default: 20.
- K — standard deviation multiplier for the Upper and Lower Bands. Range: 0.5–4.0, default: 2.
- Interval — candle timeframe.
- Method — calculation type: on bar close or per minute.
- Shift — offset of the indicator value by a given number of candles back.
Usage Examples
Section titled “Usage Examples”Scenario: filtering entries by volatility level
A bot trades using Bollinger Bands. You add a filter condition: open a trade only if BBW < 5%. This restricts entries to low-volatility periods (“squeeze”), when a strong breakout is likely.
Scenario: avoiding flat market periods
You want to avoid trading during consolidation. Add the condition BBW > 10% — the bot will only enter when the bands are wide enough and the market is in an active phase.
Summary
Section titled “Summary”Bollinger Bands is a time-tested tool that helps traders find strong entry and exit points. When properly configured and combined with filters, they can form the basis of both scalping and medium-term strategies.