Keltner Channel
The Keltner Channel is a popular technical analysis indicator that helps identify trends, volatility, and overbought/oversold zones. It is similar in appearance to Bollinger Bands, but differs in its calculation method and application principles.
How the Keltner Channel Works
Section titled “How the Keltner Channel Works”The Keltner Channel consists of three lines:
- Middle Line — Exponential Moving Average (EMA) for the selected period.
- Upper Boundary — EMA + (ATR × Multiplier).
- Lower Boundary — EMA − (ATR × Multiplier).
📌 ATR is the Average True Range indicator, which measures the volatility of an asset.
The classic setup (and the Veles bots) uses:
- Length = 20 (EMA and ATR period)
- Multiplier = 2
Differences from Bollinger Bands
Section titled “Differences from Bollinger Bands”- Calculation Method:
- Bollinger Bands use standard deviation.
- Keltner Channel uses ATR, making it less sensitive to sharp price spikes.
- Trend Behavior:
- Bollinger Bands are better for assessing the current range.
- Keltner Channel is better for identifying directional movement.
How to read signals
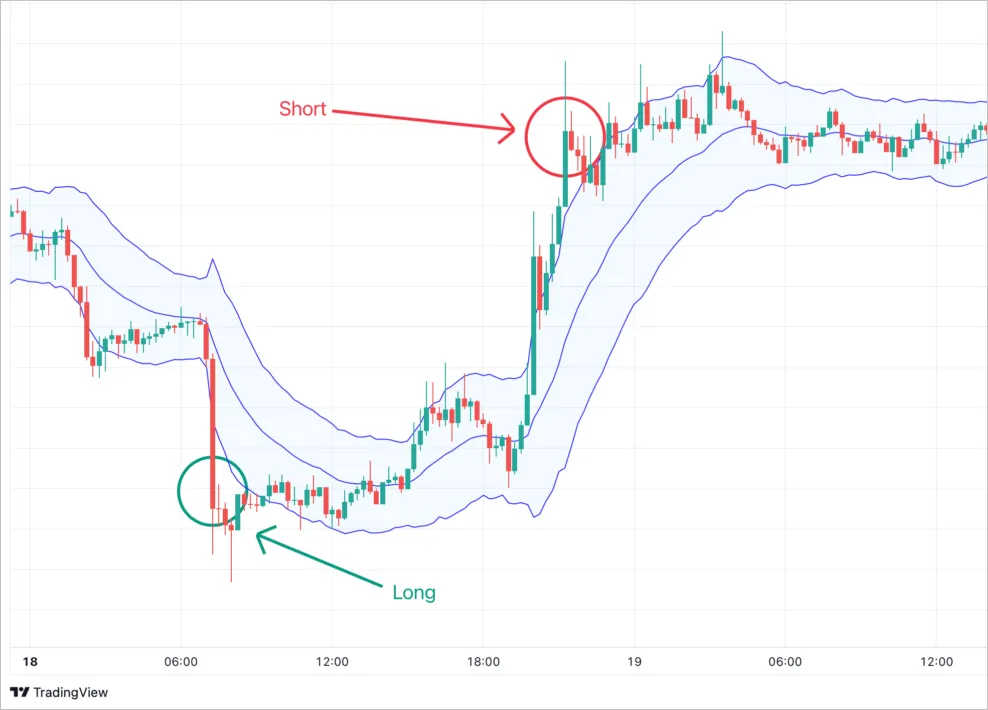
Section titled “How to read signals”- Price breaking above the upper boundary is a sign of strong upward momentum (Long on the trend or Short on the rebound – depending on the strategy).
- Price breaking below the lower boundary is a sign of strong downward momentum (Short on the trend or Long on the rebound).
- Returning inside the channel after breaking above the upper boundary is a signal of a possible correction to the EMA.
📌 In Veles, you can customize the trading logic:
- Based on a breakout of the boundaries (trend strategy).
- Based on a rebound from the boundaries (counter-trend strategy).
Trading Application
Section titled “Trading Application”- Following the Trend:
Trading in the direction of the channel breakout, ignoring signals in the opposite direction. - On a Rebound:
Entering a trade when the price returns inside the channel. - Signal Filter:
Using the Keltner indicator in conjunction with other indicators (RSI, MACD) to confirm entry points.
Advantages
Section titled “Advantages”- Good at showing the beginning and development of a trend.
- Fewer false signals during sharp movements compared to Bollinger Bands.
- Versatile: suitable for cryptocurrencies, stocks, and forex.
Limitations
Section titled “Limitations”- Can generate many false signals during a sideways market.
- Not suitable for setting profit targets – best combined with support/resistance levels.
Summary
Section titled “Summary”The Keltner Channel is a reliable tool for assessing trends and volatility. When properly configured, it helps find both trend entry points and reversal trades.
In Veles bots, the indicator can be used in conjunction with filters and other signals to reduce false entries and improve the accuracy of the strategy.