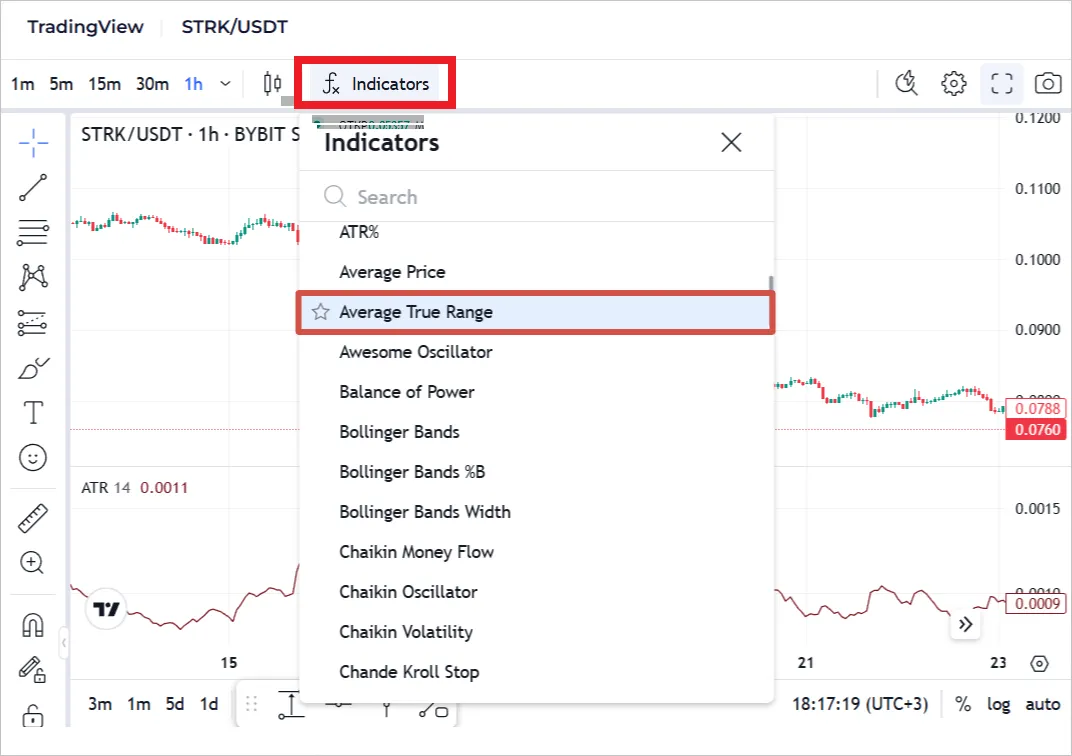
Average True Range (ATR)
ATR (Average True Range) is a technical analysis indicator that measures the volatility of an asset. Its purpose is to determine how much a price changes over a given period and to show the average value of the largest price swings.
The indicator was developed by Welles Wilder in 1978 and was initially used for commodity markets, but today it is also used for cryptocurrencies, stocks, and forex.
How ATR Works
Section titled “How ATR Works”ATR doesn’t indicate the direction of a trend (up or down), but only measures the strength of the movement. A rising ATR indicates increasing volatility, while a falling ATR indicates a weakening movement.
The calculation takes into account:
- The difference between the high and low of the current candle
- The difference between the current candle high and the previous candle close
- The difference between the current candle low and the previous candle close
Then the average of these values is taken for a given period (by default, 14 candles).
Why ATR is important in crypto trading
Section titled “Why ATR is important in crypto trading”Cryptocurrency markets often experience higher volatility than traditional assets.
ATR helps:
- Identify periods of increased or decreased market activity
- Filter trades during calm or dangerously volatile periods
- Adjust Stop Loss and Take Profit sizes
- Avoid opening a deal before strong moves against your position
ATR in Veles Bots
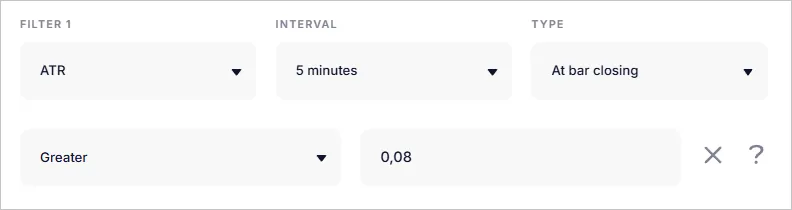
Section titled “ATR in Veles Bots”On the Veles platform, ATR can be used as an entry and closing filter.
To run a bot using volatility:
- Select the ATR filter and set the timeframe.
- Click the “Pencil” icon and set the desired value.
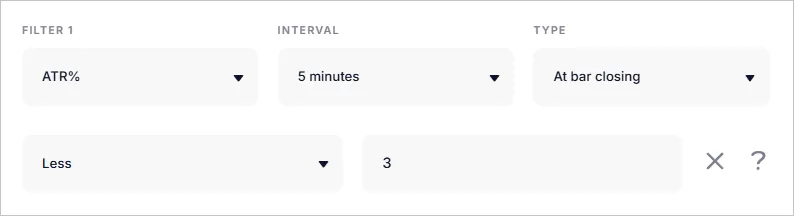
ATR% — relative volatility
Section titled “ATR% — relative volatility”ATR% is the ATR expressed as a percentage of the price. 100% = the maximum possible volatility of the asset.
To use ATR%:
- Select ATR% in the filters
- Specify the timeframe and percentage
- Set the conditions (e.g., “less than 2%”)
Interpreting values
Section titled “Interpreting values”On lower timeframes (1–15 minutes), ATR% rarely exceeds 3%;
on higher timeframes, values may be higher.
Also consider the typical volatility of a particular asset.
Example for BTC:
| Timeframe | Low Volatility | Medium | High | Extreme |
|---|---|---|---|---|
| 1–15 minutes | < 0.5% | 0.5–2% | > 2% | Rarely |
| 30 minutes – 1 hour | < 1% | 1–3% | > 3% | Rarely |
| 4 hours | < 2% | 2–5% | > 5% | > 10% |
| 1 day | < 3% | 3–7% | > 7% | > 10% |
| 1 week | < 5% | 5–10% | > 10% | > 15% |
| 1 month | < 10% | 10–20% | > 20% | > 30% |
Trade filtering example
Section titled “Trade filtering example”If you want to trade only in a quiet market:
- ATR%, 1 minute, “less than”, 2%
- ATR%, 5 minutes, “less than”, 2%
- ATR%, 15 minutes, “less than”, 3%
- ATR%, 30 minutes, “less than”, 3%
- ATR%, 1 hour, “less than”, 3%
Combining ATR with other indicators
Section titled “Combining ATR with other indicators”ATR is often combined with:
- Keltner Channels — where ATR is used to calculate channel boundaries
- Bollinger Bands — to identify high/low volatility phases
- Moving Averages — to determine trend + volatility
Limitations
Section titled “Limitations”- ATR measures movement magnitude, not direction — it cannot be used as a standalone entry signal.
- During news events or liquidation cascades, ATR can spike dramatically, causing filters to block valid entries.
- Historical ATR thresholds may not reflect current market conditions — recalibrate periodically for each asset.
Summary
Section titled “Summary”ATR and ATR% are essential volatility tools in Veles bots — helping avoid entries during dangerously volatile or completely flat conditions. With clear threshold settings, they improve strategy robustness across different market regimes and pair naturally with any trend or momentum indicator.