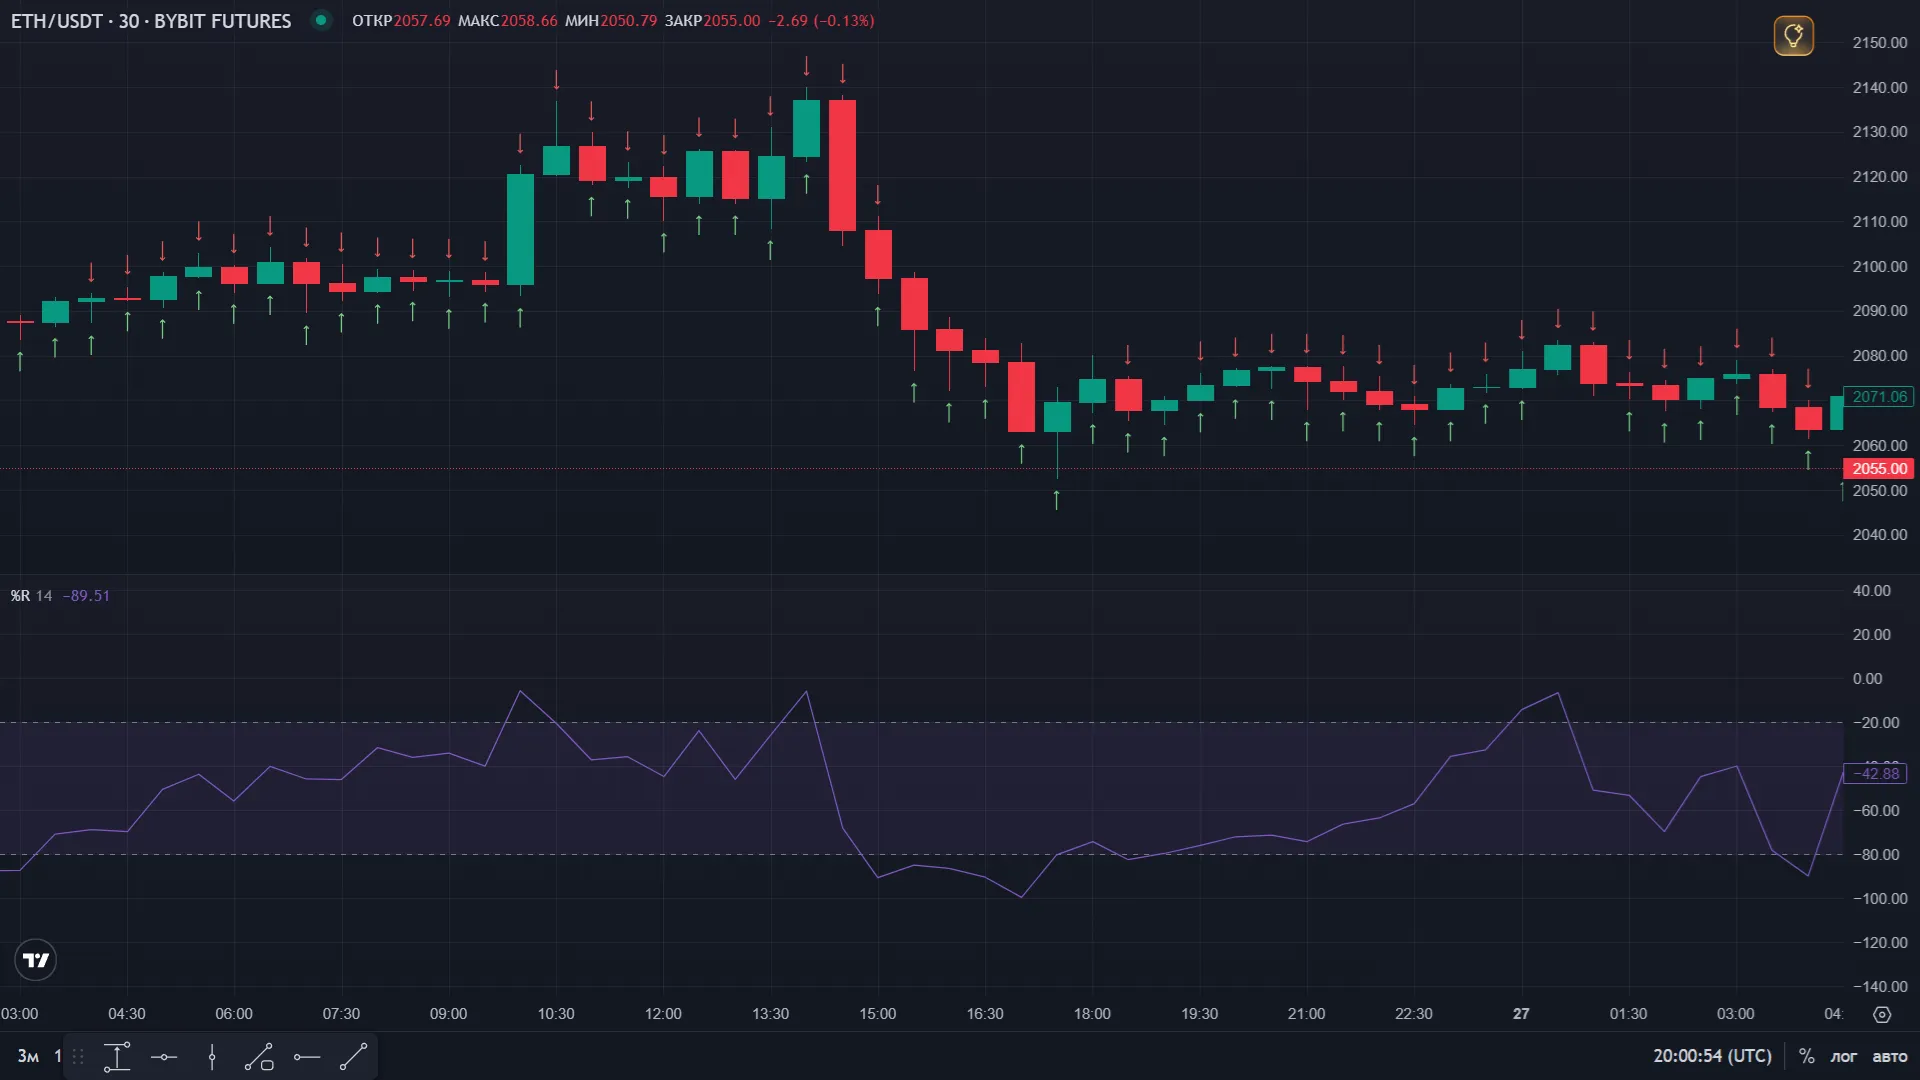
Williams %R
Williams %R or %R is a technical indicator created by Larry Williams. It shows the position of the current price relative to the range of highs and lows for a selected period.
The indicator helps identify:
- overbought zones,
- oversold zones,
- potential trend reversal points.
How %R Works
Section titled “How %R Works”Values range from -100 to 0:
- Close to -100 → the asset is oversold.
- Close to 0 → the asset is overbought.
Click the “Pencil” button to set the desired parameters.
When no value specified:
- For a long bot: entry when %R < -20, exit when %R > -80
- For a short bot: entry when %R > -80, exit when %R < -20
Main Applications
Section titled “Main Applications”1. Signal Confirmation
Section titled “1. Signal Confirmation”Use %R along with other indicators (such as Moving Averages or support/resistance levels) to confirm trade entries.
2. Overbought and oversold
Section titled “2. Overbought and oversold”- Values above -20 → the asset is overbought (possible downward reversal).
- Values below -80 → the asset is oversold (possible upward reversal).
%R Levels
Section titled “%R Levels”Two levels are typically used for analysis:
- -20 — overbought zone.
- -80 — oversold zone.
Signals:
- Crossing the -80 level from the bottom to top → Buy signal (exiting oversold zone).
- Crossing the -20 level from the top to bottom → Sell signal (exiting overbought zone).
Using in Veles Bots
Section titled “Using in Veles Bots”On the Veles platform, Williams %R is available as a filter with configurable level thresholds.
- For a Long bot: entry when %R exits the oversold zone (crosses -80 from below), exit when %R exits the overbought zone (crosses -20 from above).
- For a Short bot: entry when %R exits the overbought zone (crosses -20 from above), exit when %R exits the oversold zone (crosses -80 from below).
Click the “Pencil” button in the indicator settings to set custom threshold values.
Using in Veles Bots (Flexible Indicator)
Section titled “Using in Veles Bots (Flexible Indicator)”Available settings:
- Period - the number of candles for calculation. Range: 7–100, default 14.
- Interval - the candle timeframe.
- Method - the calculation type. By bar close (only on the selected interval) or by minute (once per minute for any interval).
- Shift - shifts the requested indicator value back by the specified number of candles.
Limitations
Section titled “Limitations”- %R can remain in overbought or oversold zones for extended periods during strong trends, generating early reversal signals.
- On short timeframes, the indicator produces frequent noise — pairing with a trend filter is recommended.
- The inverted scale (0 to -100) can be counterintuitive; always verify the signal direction before using.
Summary
Section titled “Summary”Williams %R is a fast and responsive oscillator for identifying price extremes within a given period. In Veles bots, it serves as a clean overbought/oversold filter — most effective when combined with a trend indicator to ensure entries align with the broader market direction.