Hull Volume Moving Average
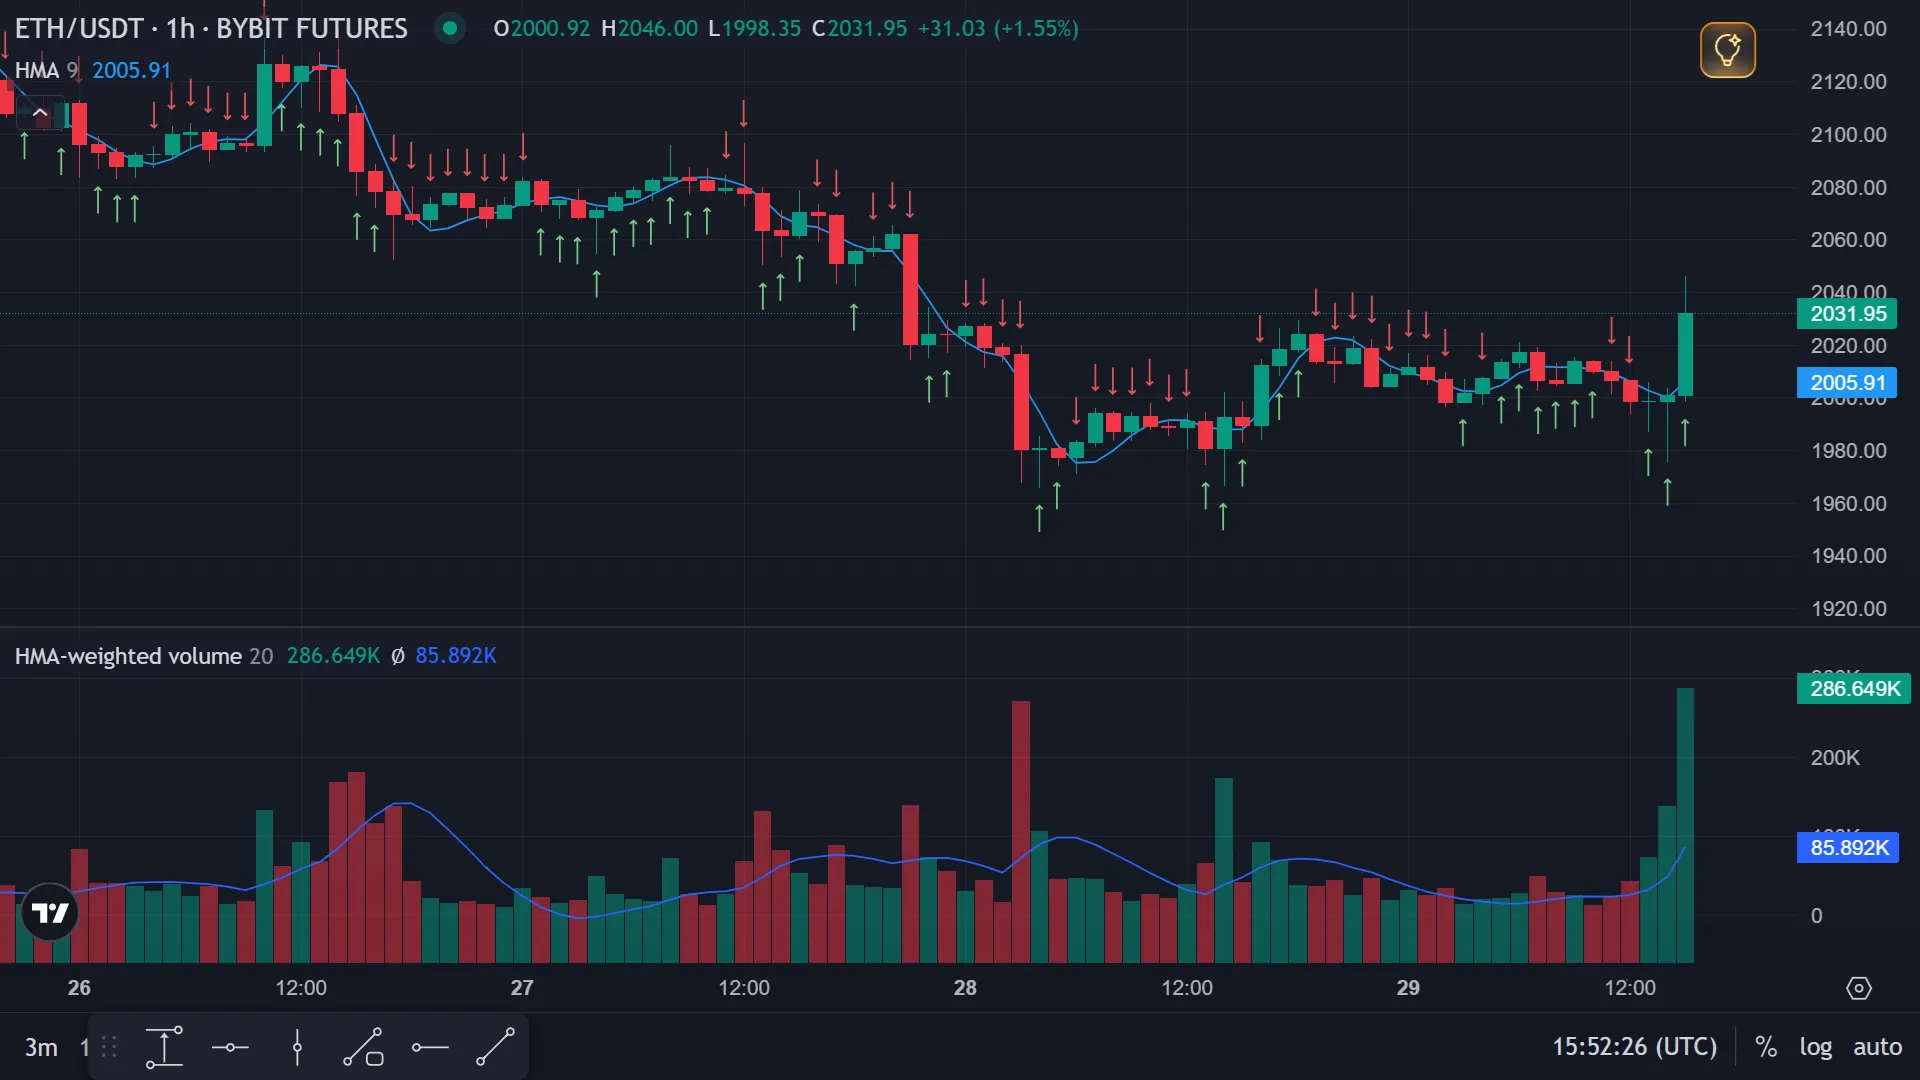
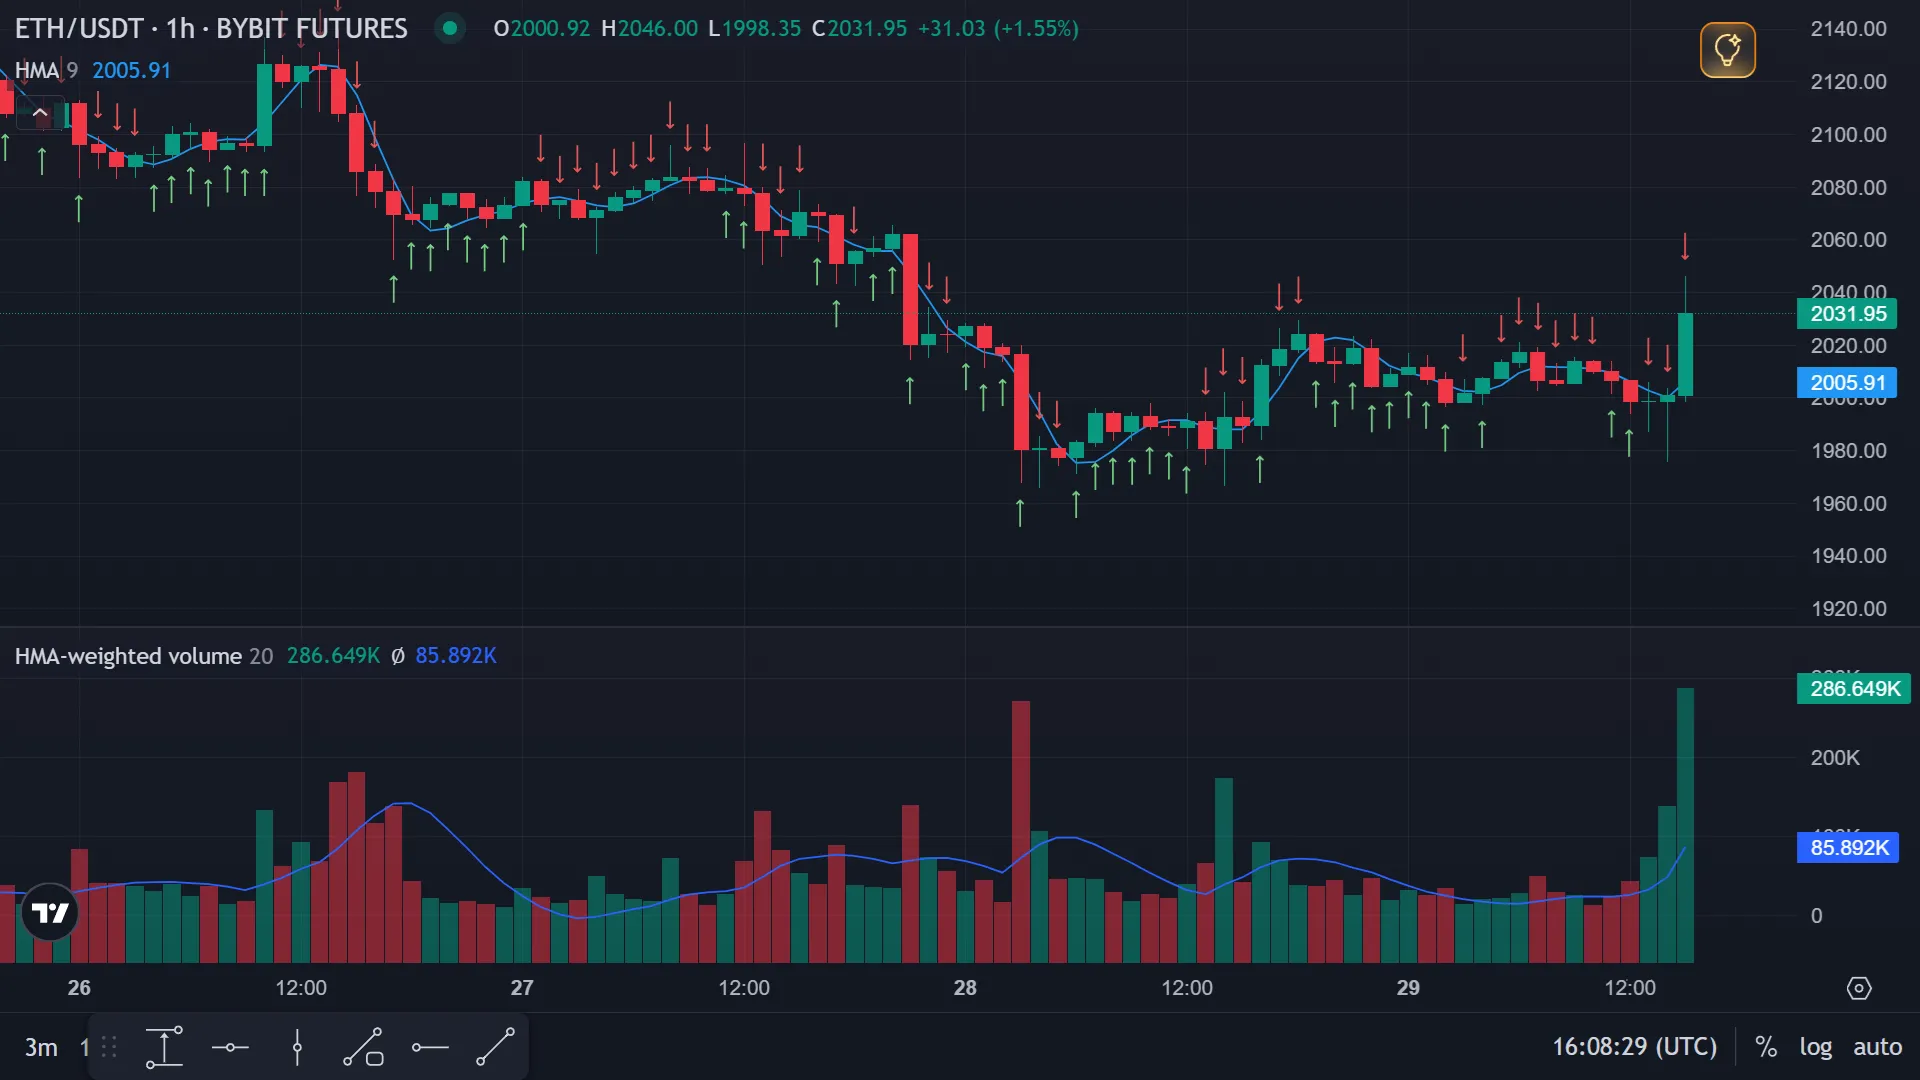
The Hull Volume Moving Average (HMA-weighted volume) is an indicator that compares current trading volume with its average value calculated using the Hull Moving Average (HMA). It helps identify periods of increased or decreased activity and filters out “empty” movements — that is, it confirms (or refutes) the strength of the current momentum.
How HMA Volume Works
Section titled “How HMA Volume Works”- Volumes are taken for a period of N on the selected timeframe.
- HMA(N) is calculated using these volumes.
- The signal is generated by comparing the current volume with the HMA of volume.
Signal Logic (Basic Mode)
Section titled “Signal Logic (Basic Mode)”-
Open Long (or Close Short) — when current volume is above the HMA by volume (there is momentum/interest in the market).
-
Open Short (or Close Long) — when current volume is below the HMA by volume (interest is decreasing, momentum is fading).
“Reverse Signal” Mode
Section titled ““Reverse Signal” Mode”When the “Reverse Signal” option is enabled, the logic is inverted:
- Short signal — with increased volumes (playing against the momentum during a surge).
- Long signal — with decreased volumes (entry “during a cooldown”).
Useful in strategies aimed at opening a short deal during a volume surge:
Using in Veles Bots
Section titled “Using in Veles Bots”- Add the indicator to the “Trade Entry Conditions” block. It will only allow entry if the volume condition relative to the HMA is met.
- In the “Exit trade → Signal” block, the indicator can be used as an exit condition (for example, to lock in profits when activity tapers off).
Recommended Combinations
Section titled “Recommended Combinations”- Trend + Volume: Supertrend / EMA (trend) + HMA volume (momentum confirmation).
- Channel Strategies: Bollinger Bands / Keltner Channel + HMA volume to filter out false breakouts.
- Oscillators: RSI / Stochastic / CCI provide a zone, HMA volume confirms the strength of the move.
Practical Settings
Section titled “Practical Settings”- HMA Period (N):
- Short TFs (1–5m): N = 14–28 — more sensitive to spikes.
- Medium TFs (15–60m): N = 20–50 — smooths out noise, catches stable impulses.
- Timeframe: the higher it is, the fewer false triggers, but the less frequent the signals.
- Calculation Method: we recommend “At Bar Closing” (rather than “Once per Minute”) — this reduces the number of “flashing” conditions.
Strengths and Limitations
Section titled “Strengths and Limitations”Pros
- Good at identifying real impulses: not just price movements, but movements supported by volume.
- Helps avoid false entries during periods of low liquidity.
What to pay attention to
- News/spikes can briefly “overheat” volume – add a trend filter or price confirmation.
- On thin instruments (low liquidity), it’s better to increase the N period or timeframe.
- On futures, consider funding and the impact of leverage on risk management.
Using in Veles Bots (Flexible Indicator)
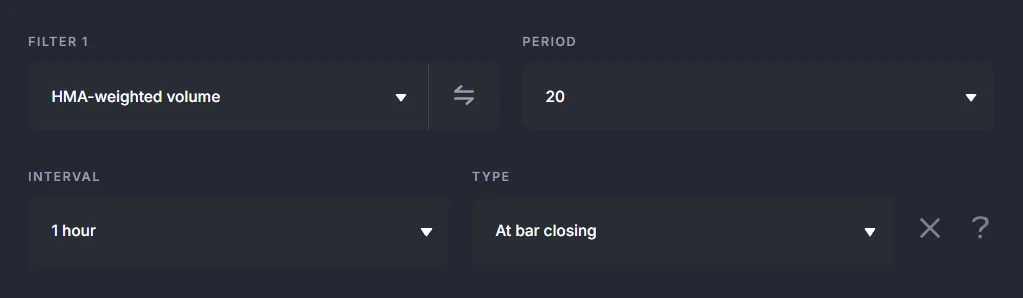
Section titled “Using in Veles Bots (Flexible Indicator)”Available settings:
- Period - the number of candles for calculation. Range: 4–500, default 9.
- Interval - the candle timeframe.
- Method - the calculation type. By bar close (only on the selected interval) or by minute (once per minute for any interval).
- Shift - shifts the requested indicator value back by the specified number of candles.
Summary
Section titled “Summary”The Hull Volume Moving Average is a reliable filter for confirming that price moves are backed by real trading activity. In Veles bots, it excels as a companion to trend indicators — ensuring entries occur during genuine impulses rather than low-liquidity drifts.