SuperTrend
Supertrend is a trend indicator developed by Olivier Seban that helps determine trend direction and entry/exit points based on closing prices and volatility. It is equally suitable for all timeframes and instruments.
How Supertrend Works
Section titled “How Supertrend Works”The indicator uses a combination of two tools:
- CCI — measures the deviation of the current price from its average price over a period, indicating the strength and direction of the trend.
- ATR — shows the volatility of the instrument, assessing price fluctuations.
Supertrend combines trend strength (CCI) and volatility (ATR), allowing you to quickly detect changes in direction and find optimal entry/exit points.
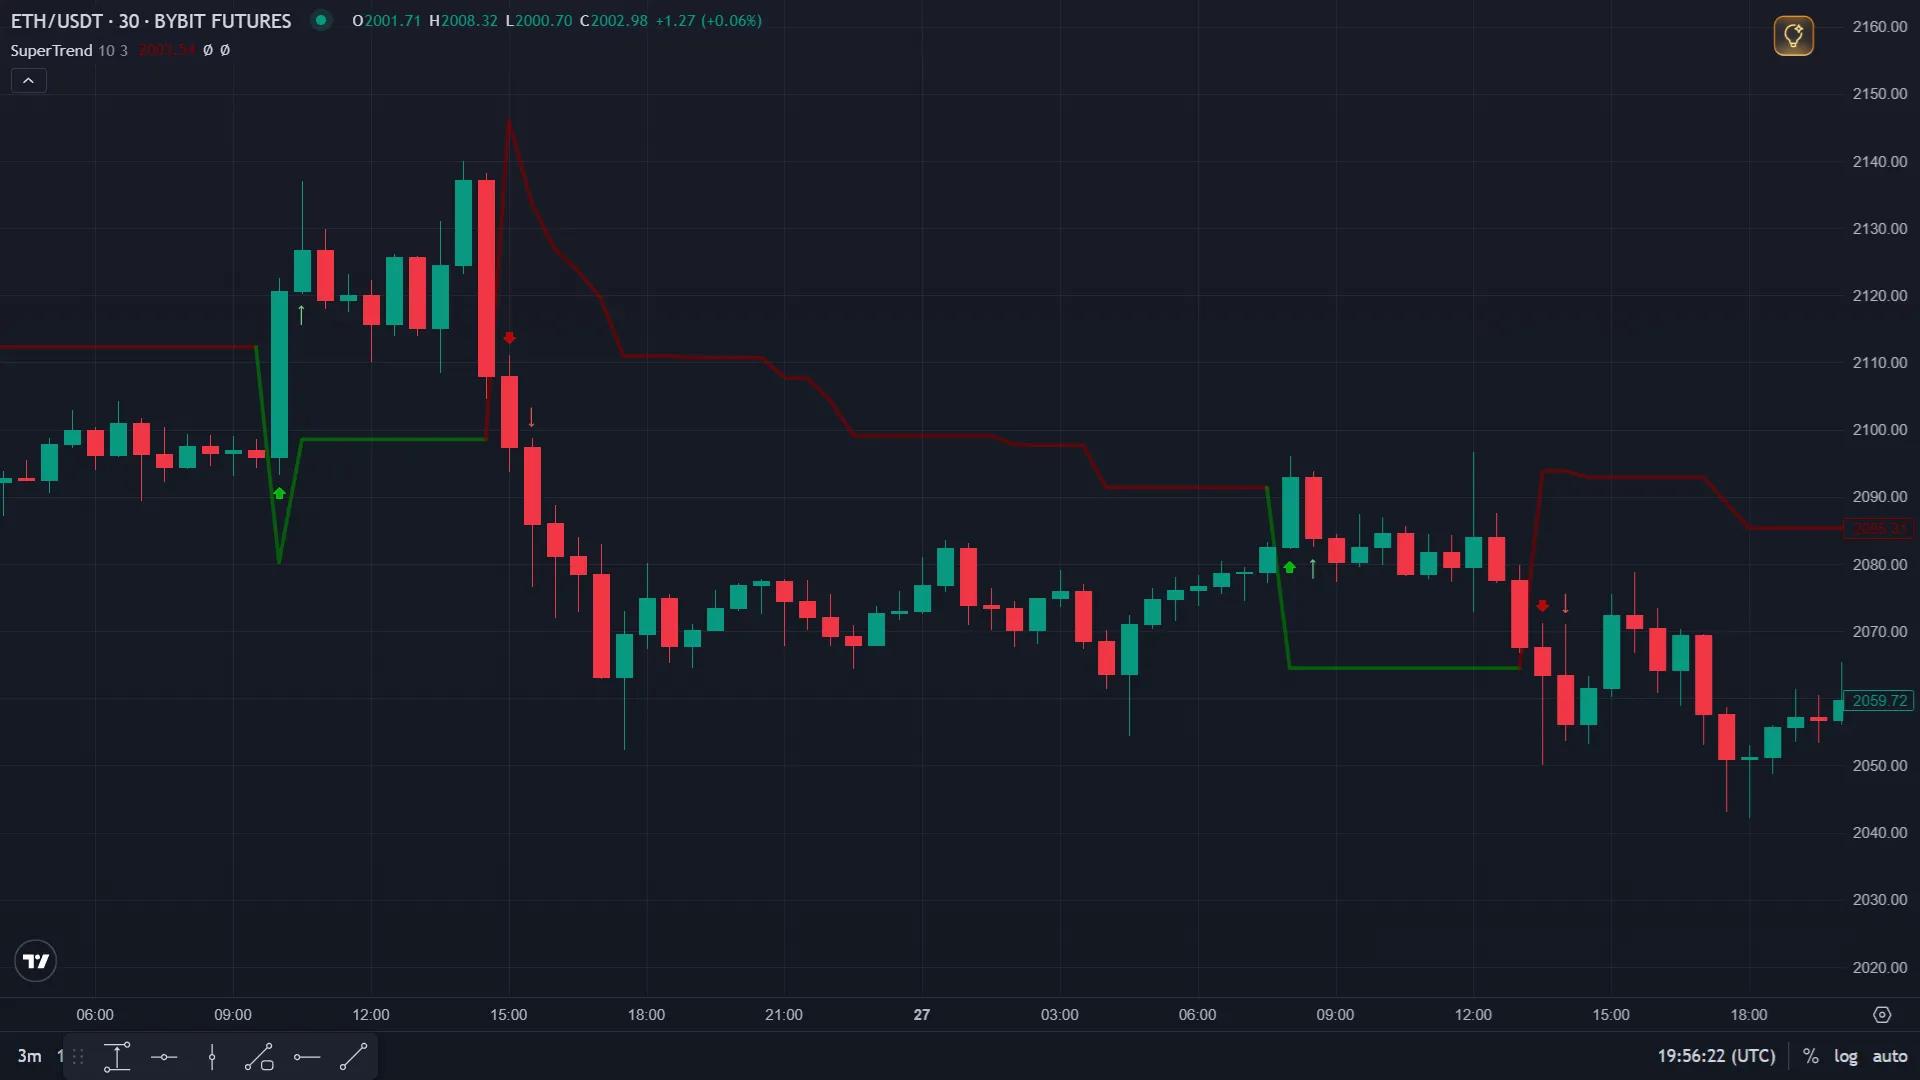
On the chart, Supertrend is displayed as a line whose color and position depend on the trend direction and volatility.
Supertrend Signals
Section titled “Supertrend Signals”- Price and Line Crossing
- Price crosses the line from below upward → possible upward reversal, signal to open a Long deal.
- Price crosses the line from above downward → possible downward reversal, signal to open a Short deal.
- Line Color
- Green line → uptrend.
- Red line → downtrend.
- Line Slope
- Upward slope → uptrend.
- Downward slope → downtrend.
- Line Direction Change
- Upward to downward slope → downtrend signal.
- Downward to upward slope → uptrend signal.
Trading Applications
Section titled “Trading Applications”Supertrend is suitable for:
- Trend detection.
- Filtering false signals.
- Setting Stop Losses in the direction of the line.
- Combining with other indicators (RSI, MACD) to confirm signals.
Flexible adjustments to the ATR period and multiplier allow the indicator to be adapted to any strategy.
Using in Veles Bots
Section titled “Using in Veles Bots”Two signal options are available:
- Supertrend Trend Change — open a deal when the line changes direction (changes color) on the selected timeframe.
- Supertrend Trend — the signal is active as long as the current trend persists (the line color does not change).
Using in Veles Bots (Flexible Indicator)
Section titled “Using in Veles Bots (Flexible Indicator)”Available settings:
- Period - the ATR period used to measure volatility. Range: 3–100, default 10.
- K - the ATR multiplier that determines the channel width. Range: 1.0–6.0, default 3.
- Interval - the candle timeframe.
- Method - the calculation type. By bar close (only on the selected interval) or by minute (once per minute for any interval).
- Shift - shifts the requested indicator value back by the specified number of candles.
Limitations
Section titled “Limitations”- Supertrend performs poorly in flat or sideways markets, generating frequent false signals.
- Aggressive ATR multiplier settings can delay signals; conservative settings may cause premature exits.
- Like most trend indicators, signals appear after a move has begun — not at the exact reversal point.
Summary
Section titled “Summary”Supertrend is a clean and effective trend-following indicator that combines ATR volatility with CCI trend strength. Its two signal modes in Veles (Trend and Trend Change) make it adaptable to both signal-based and condition-based strategies. It is most reliable on higher timeframes and when paired with RSI or volume filters to confirm signal quality.