Chaikin Oscillator
The Chaikin Oscillator is a technical indicator that measures capital inflows and outflows into an asset, helping to assess trend strength, market sentiment, and potential reversals. Essentially, it’s a variation of the MACD, but instead of price data, it uses the Accumulation/Distribution Line (A/D Line).
How the Chaikin Oscillator Works
Section titled “How the Chaikin Oscillator Works”The Chaikin Oscillator is based on the difference between:
- The Accumulation/Distribution Line
- The Exponential Moving Average (EMA) of this line
It reflects the balance between buying and selling over a given period of time.
Main purposes of use:
- Determining the strength and direction of a trend
- Identifying overbought and oversold zones
- Confirming signals from other indicators
- Finding divergences between price and volume
The indicator is especially useful for analyzing whether price movement is supported by adequate trading volume. For example, a rising price while the oscillator is falling may signal a weak trend.
How to apply in trading
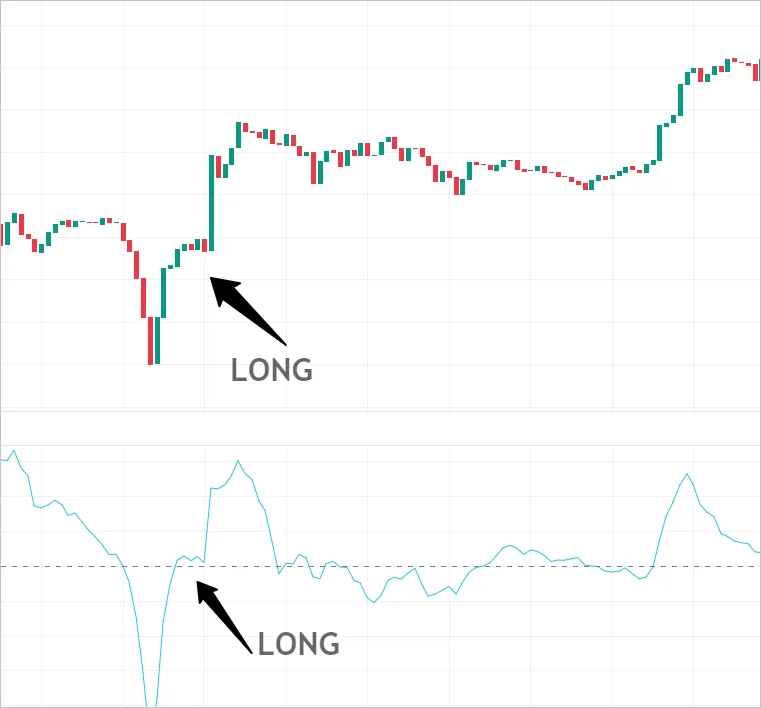
Section titled “How to apply in trading”- Positive values → predominantly buying (bullish signal)
- Negative values → predominantly selling (bearish signal)
- Crossing the zero line from below to above → possible Buy-signal
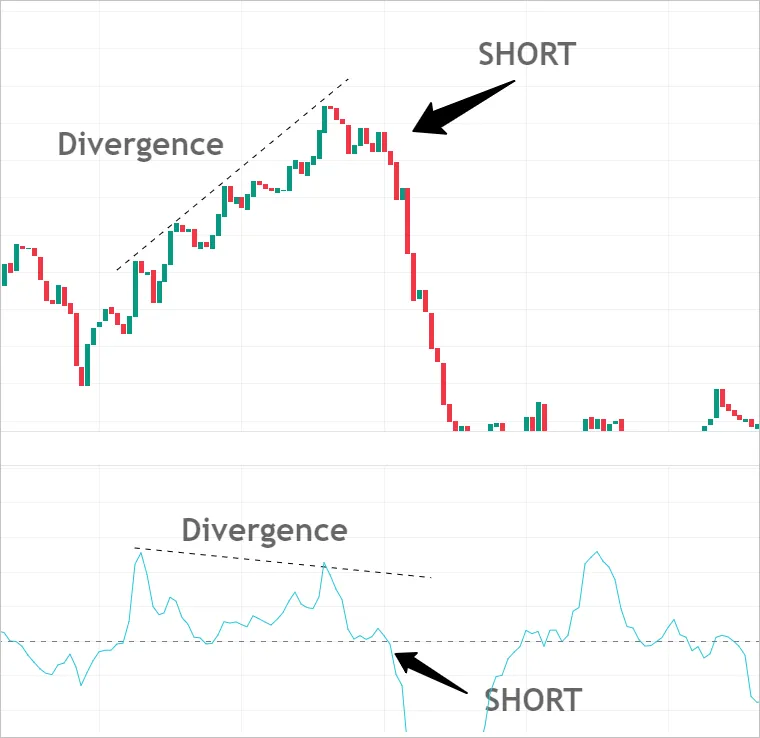
- Crossing the zero line from above to below → possible Sell-signal
Divergences
Section titled “Divergences”If the price makes new highs/lows, but the Chaikin Oscillator doesn’t confirm this, a divergence occurs — a signal of a possible trend reversal.
Usage Recommendations
Section titled “Usage Recommendations”- Analyze the oscillator on higher timeframes to filter out market noise
- Use in conjunction with trend indicators (MA, EMA, ADX) to filter out false signals
- Pay attention to sharp spikes — they often coincide with key entry or exit points
Limitations
Section titled “Limitations”- As a momentum oscillator based on moving averages, the Chaikin Oscillator lags slightly and is not ideal for fast scalping.
- In low-volume or flat markets, it can generate misleading signals.
- Divergence signals require additional confirmation — they are not sufficient on their own for entry decisions.
Summary
Section titled “Summary”The Chaikin Oscillator is a valuable tool for assessing whether price moves are backed by real capital flows. It works best as a confirmation filter alongside trend indicators and is especially useful for identifying divergences where price and money flow disagree.