Liquidation Heatmap
Liquidation Heatmap is a volume analysis tool that highlights areas of increased trading activity on the chart. It highlights candles where the volume significantly exceeds the average level and builds colored zones around them:
- green on bullish candles (price increase)
- red on bearish candles (price decrease).
These zones reflect places where large capital entered the market and often act as dynamic support or resistance levels at which the price may reverse, slow down, or continue moving.
How the Liquidation Heatmap Works
Section titled “How the Liquidation Heatmap Works”The indicator analyzes the volume of each candle and compares it to the average value. The average volume is calculated as the exponential moving average (EMA) of the volume for 20 candles.
Then the excess is calculated:
E = (Current volume − EMA volume) / EMA volume
Based on this value, the following is determined:
- The appearance of a zone (if E is above the specified threshold).
- The intensity of the zone color (the higher E, the more saturated the color).
The distance to the zones is calculated based on current market volatility using the ATR (Average True Range) indicator for 20 periods.
Two types of zones are built: boxes and lines.
- Box — liquidation zone. This is the price range where stop losses and liquidations are concentrated. It is calculated from the extreme of the candlestick (low for bullish, high for bearish) with an indent of 0.35 ATR.
- Line — full liquidation level. This is the price at which positions with leverage in this zone will be completely liquidated. It is calculated at a distance of 1 ATR.
The zone remains on the chart until the price breaks through it (i.e., passes through it completely).
This allows traders to see historical areas of volume accumulation and use them to predict price reactions.
Liquidation Heatmap Signals
Section titled “Liquidation Heatmap Signals”- Green zone on a bullish candle: a signal of increased buyer interest, potential support for further growth.
- Red zone on a bearish candle: a signal of strong seller pressure, potential resistance to a decline.
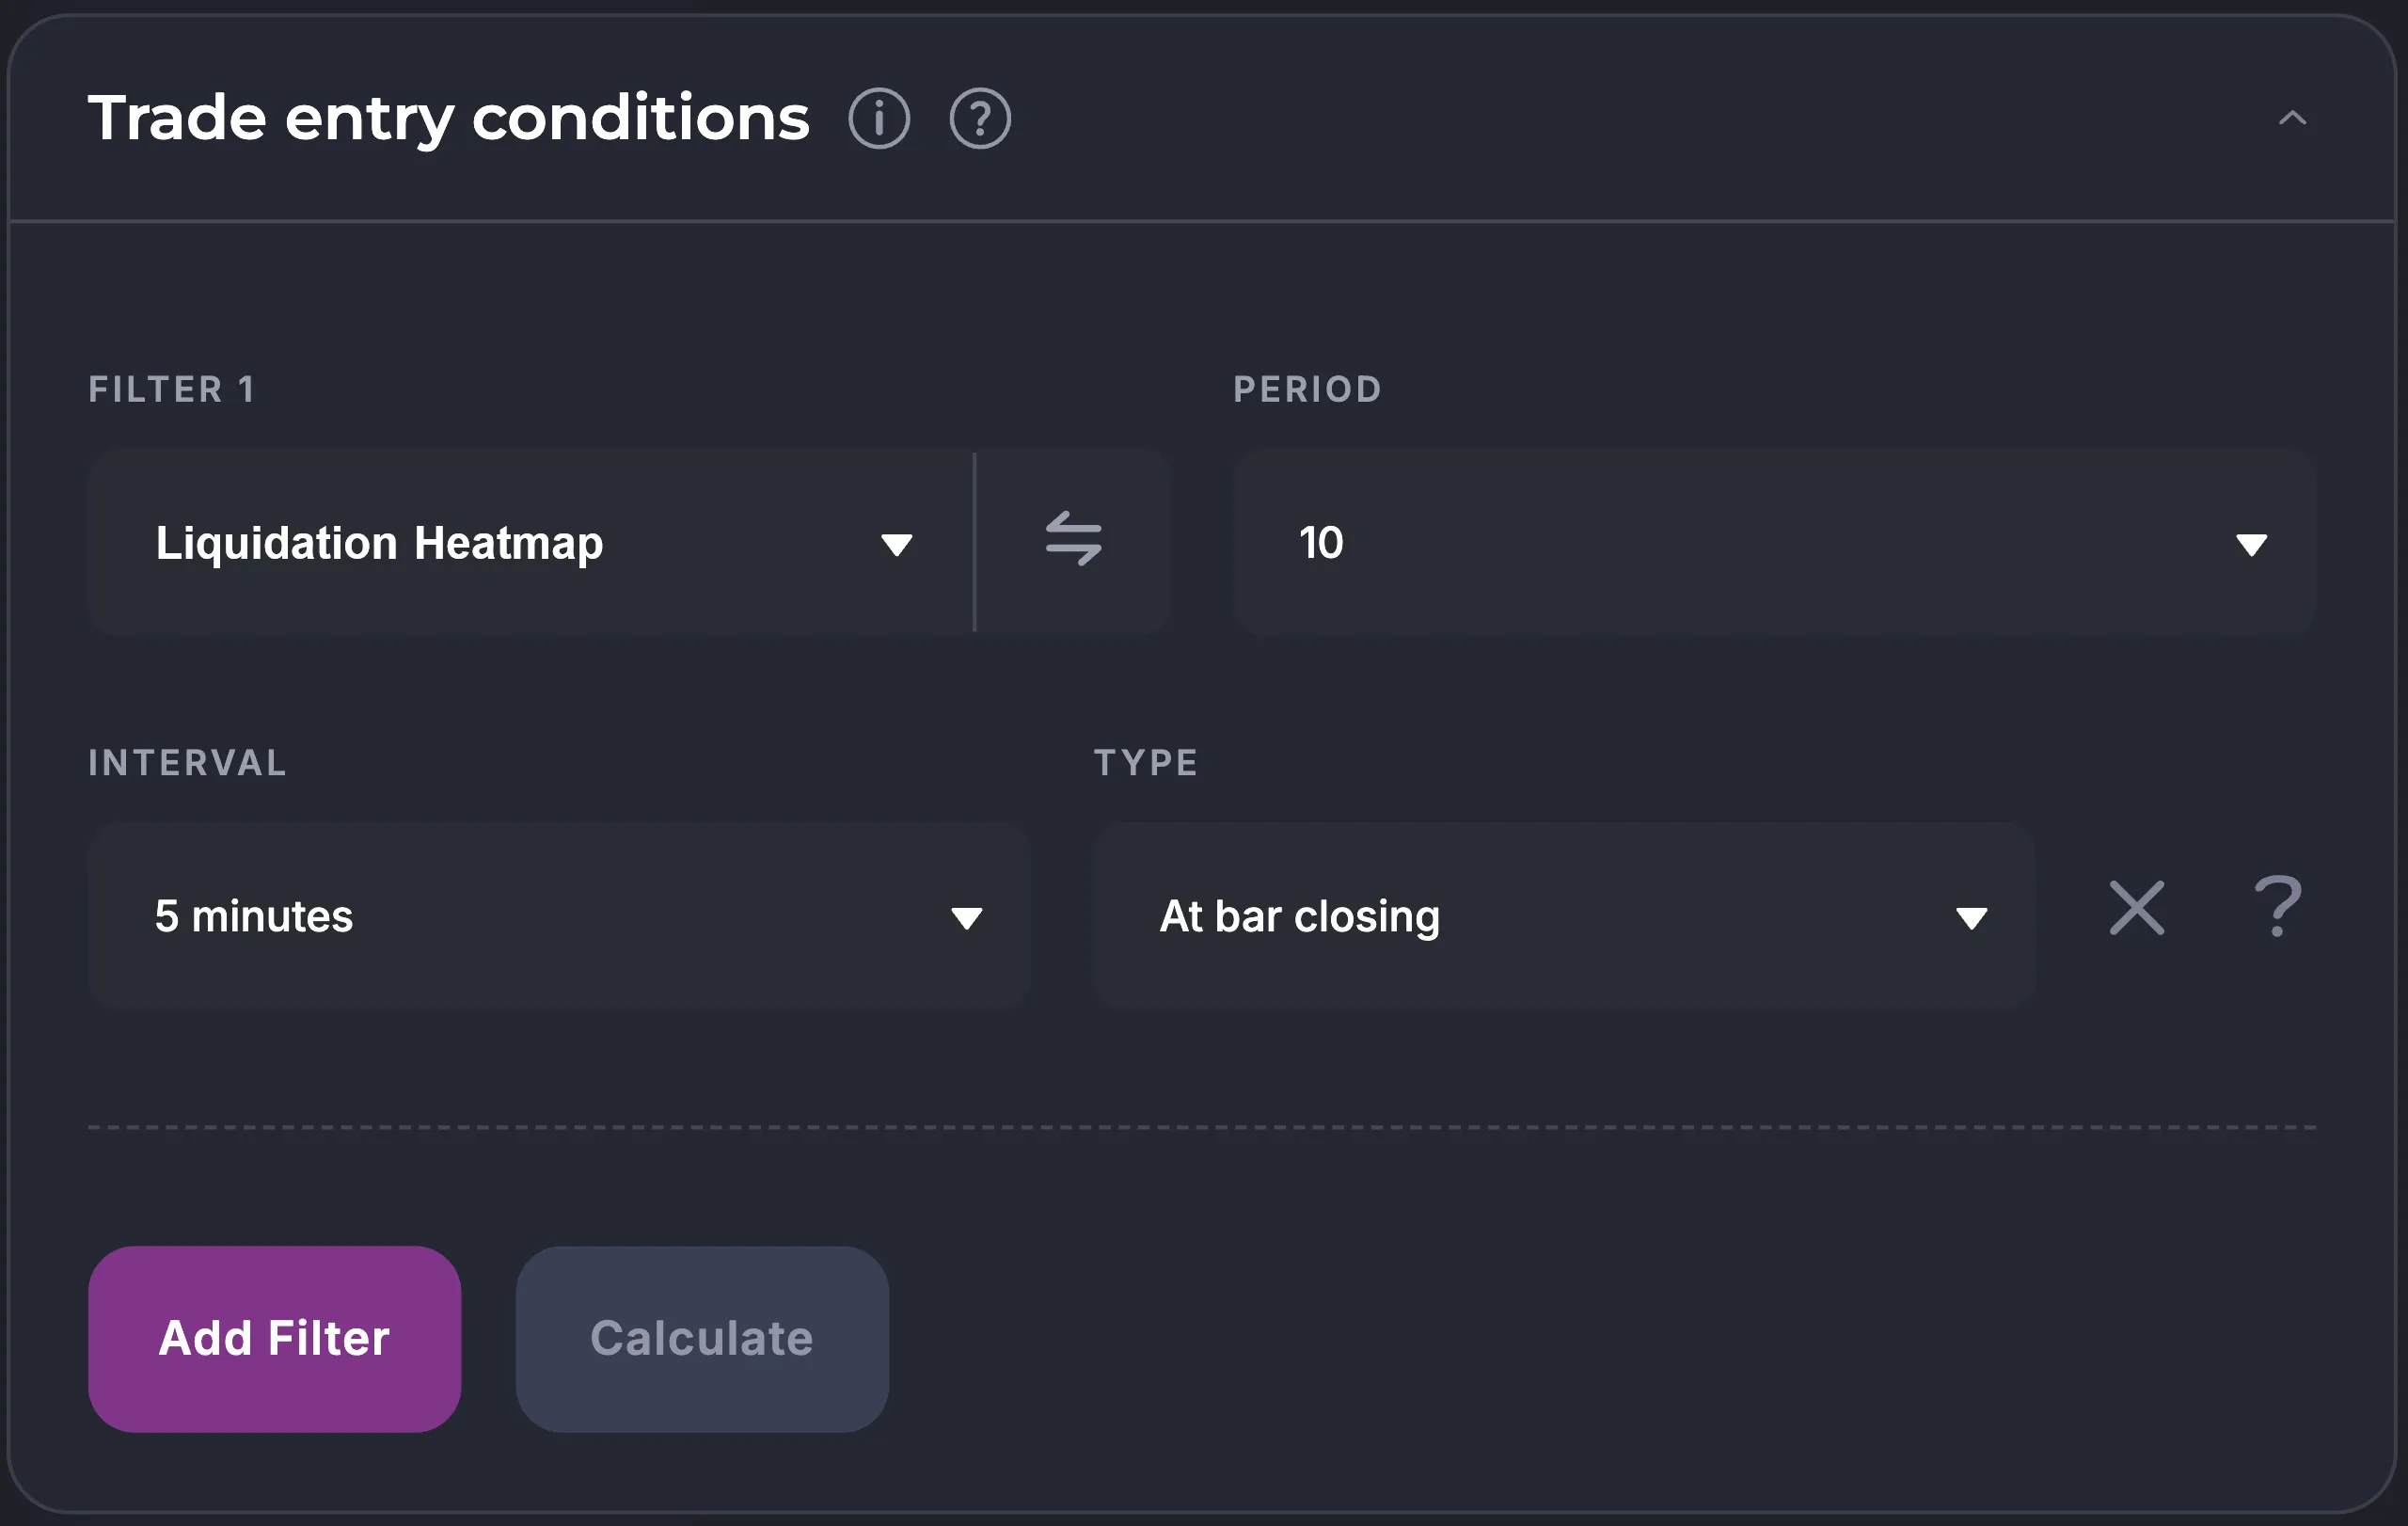
Using in Veles Bots
Section titled “Using in Veles Bots”On the Veles platform, indicator zones can be used as entry conditions: for example, opening a position after crossing the zone, counting on a price reversal or continuation of the movement (reversal signal). A signal appears when a candle’s body or wick crosses the zone.
For manual trading, zones help determine key levels for setting stop losses, take profits, or entering a trade.
The main parameter is “Period”. It determines the minimum excess of volume over the average (in percent) at which the zone is constructed. Available values: 10, 50, 75, 100, 125, 150, 175, 200.
Examples:
- 50 — volume approximately 1.5 times higher than average (zones appear frequently but are weaker).
- 100 — volume 2 times higher than average (balance of frequency and signal strength).
- 200 — volume 3 times higher than average (rare but powerful zones).
Recommended for use with the “At bar close” calculation type.
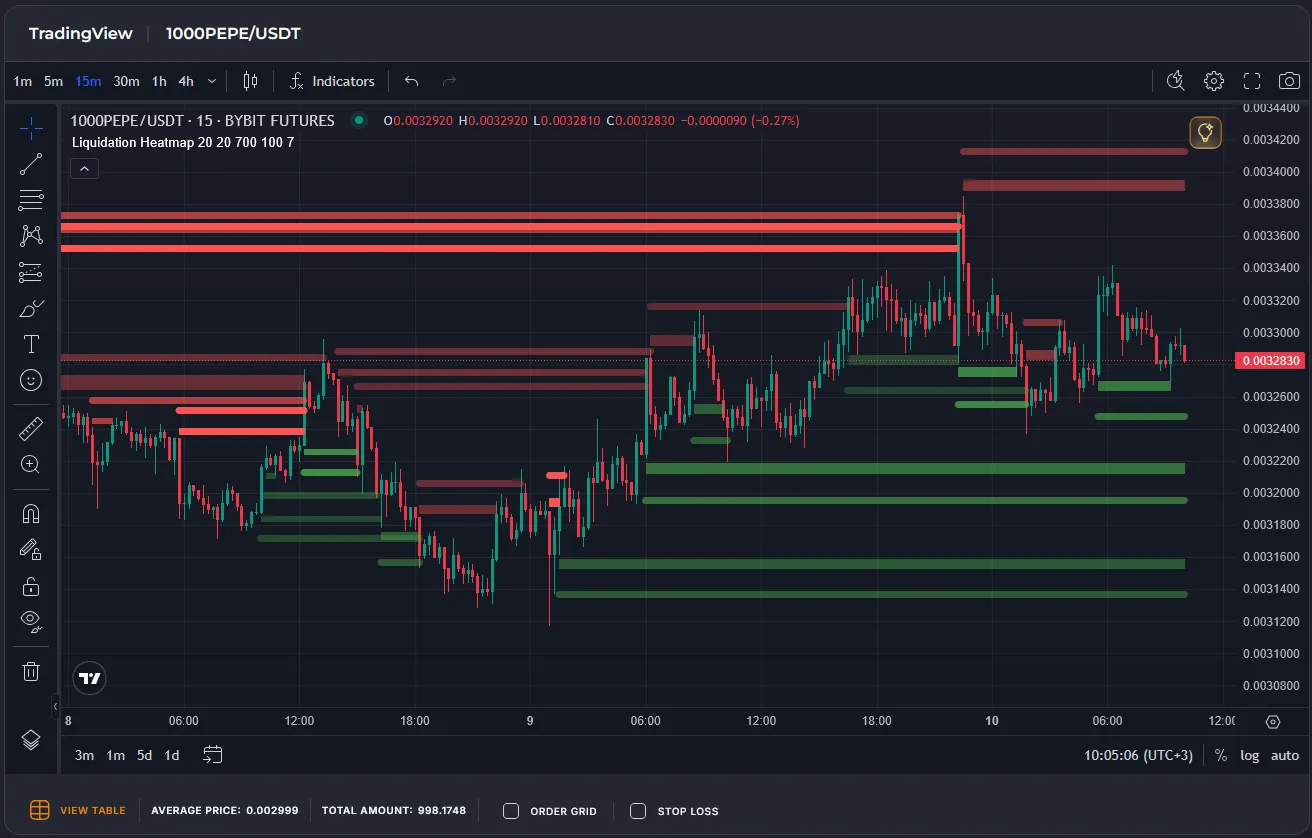
Display on the Chart
Section titled “Display on the Chart”The Liquidation Heatmap is drawn directly on the TradingView chart as colored zones around candles with increased volume.
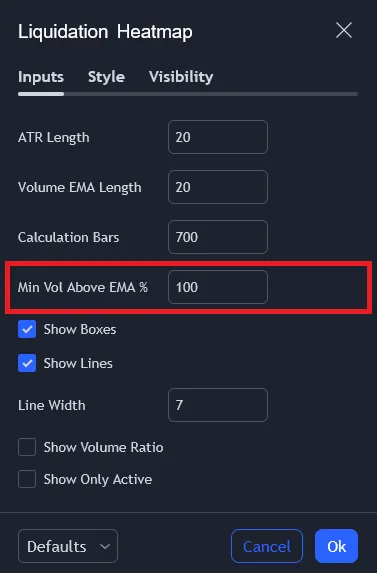
Indicator Settings
Section titled “Indicator Settings”The “Period” parameter in the editor corresponds to the “Min. volume above EMA%” parameter in the indicator settings. When the value is changed, the zones are automatically rearranged: at low values, more zones will be displayed; at high values, zones will only be drawn at extreme spikes. If the value is 0, the indicator displays zones on each candle where the volume exceeds the average.
Other optional settings:
- “Show Volume Ratio” — displays numerical labels with the level of volume exceeding within the zones (for example, +150%). This helps to more accurately assess the strength of the zone.
- “Show Only Active” — this option hides zones that have already been crossed by the price.
Limitations
Section titled “Limitations”- Liquidation Heatmap displays historical volume spikes, but does not guarantee that the price will necessarily react to these zones in the future — the market may ignore them in the event of a strong trend or news.
- On illiquid assets or low timeframes, zones may be less reliable due to noise in the volume data.
- Fixed calculation periods for EMA (20) and ATR (20) may not be ideal for all markets — it is recommended to test them on specific assets.
- The zones do not take into account the type of volume (buy/sell), only its total value.
Summary
Section titled “Summary”Liquidation Heatmap is an effective tool for visualizing volume levels, transforming abstract volume data into understandable support/resistance zones. It is especially useful in crypto trading, where volume spikes often precede strong movements.
Examples of combinations with other indicators:
- Liquidation Heatmap + Candlestick Trend (entry after a series of candlesticks of the same color in a zone of increased volume).
- Liquidation Heatmap + ATR% (filtering zones only in volatile periods).
- Liquidation Heatmap + RSI (reversal from overbought/oversold zone).
Before using, be sure to perform a backtest and make sure that the selected parameters and filter combinations match your trading style.