Parabolic SAR (PSAR)
The Parabolic SAR (Parabolic Stop and Reverse) is a trend-following indicator that helps determine price direction and potential reversal points. Developed by Welles Wilder, it is used both for identifying entry/exit points and for setting dynamic Stop Losses.
How the Parabolic SAR Works
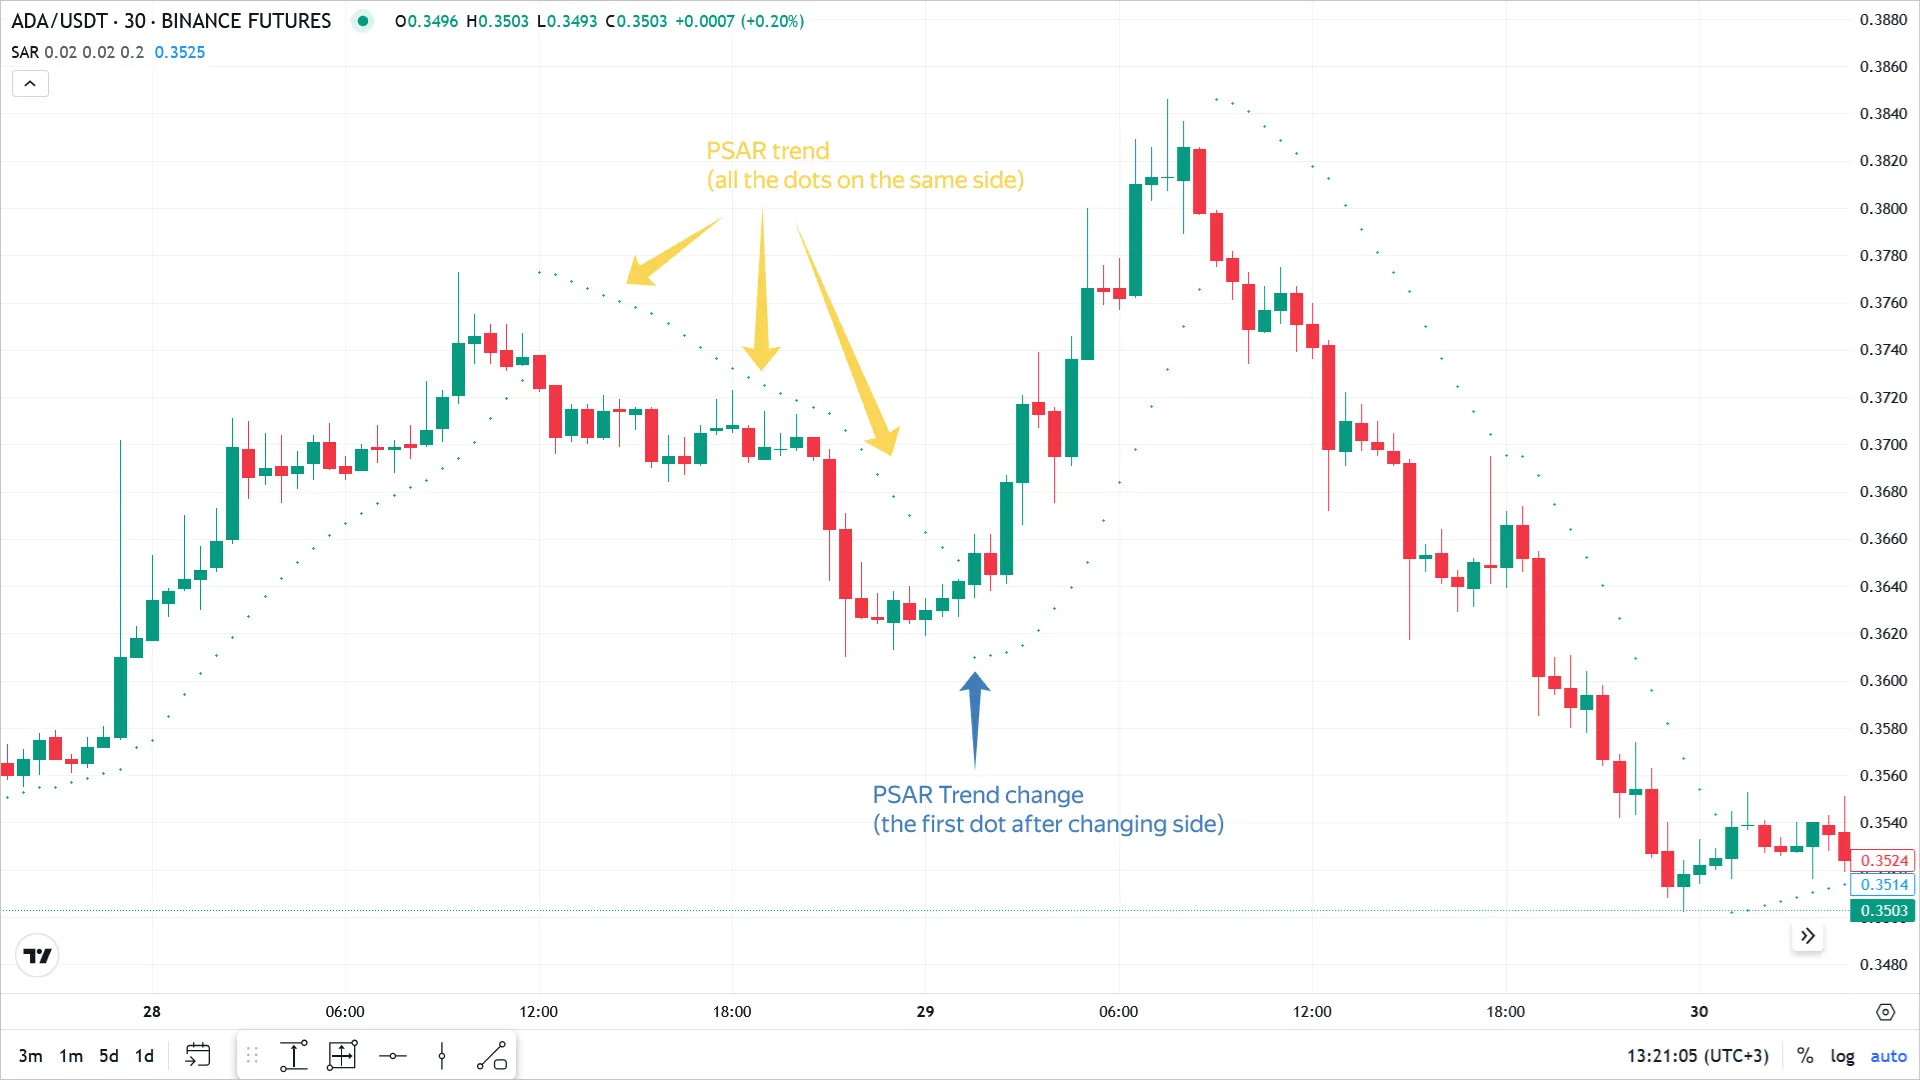
Section titled “How the Parabolic SAR Works”The PSAR indicator is displayed on the chart as dots:
- Below the price — uptrend.
- Above the price — downtrend.
The dots move with the price, changing sides when the trend changes.
The indicator is available in two modes:
- SAR Trend — the signal is active as long as the dots are on the same side of the price.
- SAR Trend Change — the signal appears only when the dots move to the opposite side.
Traders use PSAR to set Trailing Stops:
If the price rises and the SAR dots are below it, the Stop Loss can be moved to the dot level. When the price breaks the SAR level, it can serve as a signal to close the deal.
How to use in trading
Section titled “How to use in trading”- Trade entry and exit
- A top-to-bottom transition of the dots → a possible upward reversal, a Buy (open Long) signal.
- A bottom-to-top transition of the dots → a possible downward reversal, a Sell (open Short) signal.
- Position management
- Use the SAR dots as levels to adjust Stop Losses as the price moves.
- Signal filtering
- PSAR works better during trending phases. In a sideways market, it can generate many false signals.
Limitations
Section titled “Limitations”- The indicator is always active, even when there is no trend, so it generates more false signals during flat periods.
- A reversal signal may occur not due to a real change in price direction, but due to the formula’s peculiarities (the accelerating factor catches up with the price).
- It is not recommended to use PSAR alone. For increased accuracy, it is combined with other indicators: ADX, MA (SMA), and trend lines.
Difference between PSAR and Moving Average
Section titled “Difference between PSAR and Moving Average”- MA — averages the price over a specified number of periods.
- PSAR — tracks extremes (highs/lows) and applies an acceleration factor.
- MA smooths out fluctuations and shows the overall trend, while PSAR provides clearer potential reversal points.
Using in Veles Bots
Section titled “Using in Veles Bots”- SAR Trend — entry/exit based on the direction of the dots.
- SAR Trend Change — a signal when the position of the dots changes relative to the price on the selected timeframe.
Summary
Section titled “Summary”The Parabolic SAR is an intuitive trend-following tool that provides both directional signals and dynamic stop-loss levels. Its two modes in Veles (SAR Trend and SAR Trend Change) offer flexibility — best combined with ADX or Moving Averages to filter out false reversals during sideways markets.