Rate of Change (RoC)
ROC (Rate of Change) is a technical analysis indicator that shows the percentage change in an asset’s price over a specified period of time. It helps traders assess market dynamics, identify trend accelerations or decelerations, and identify overbought and oversold zones.
The Veles platform uses a period of 9 candles for ROC.
How ROC Works
Section titled “How ROC Works”The ROC value is calculated using the formula:
ROC = [(Current price - Price N periods ago) / Price N periods ago] × 100%Where N is the selected period (e.g., 9 candles).
ROC is expressed as a percentage and shows the speed and direction of price change:
- Positive value → the price has increased relative to the previous period
- Negative value → the price has decreased relative to the previous period
- The higher the absolute ROC value, the higher the volatility
Using ROC in Trading
Section titled “Using ROC in Trading”1. Trend Determination
Section titled “1. Trend Determination”- ROC Rising → Strengthening bullish trend
- ROC Falling → Strengthening bearish trend
2. Overbought and Oversold Zones
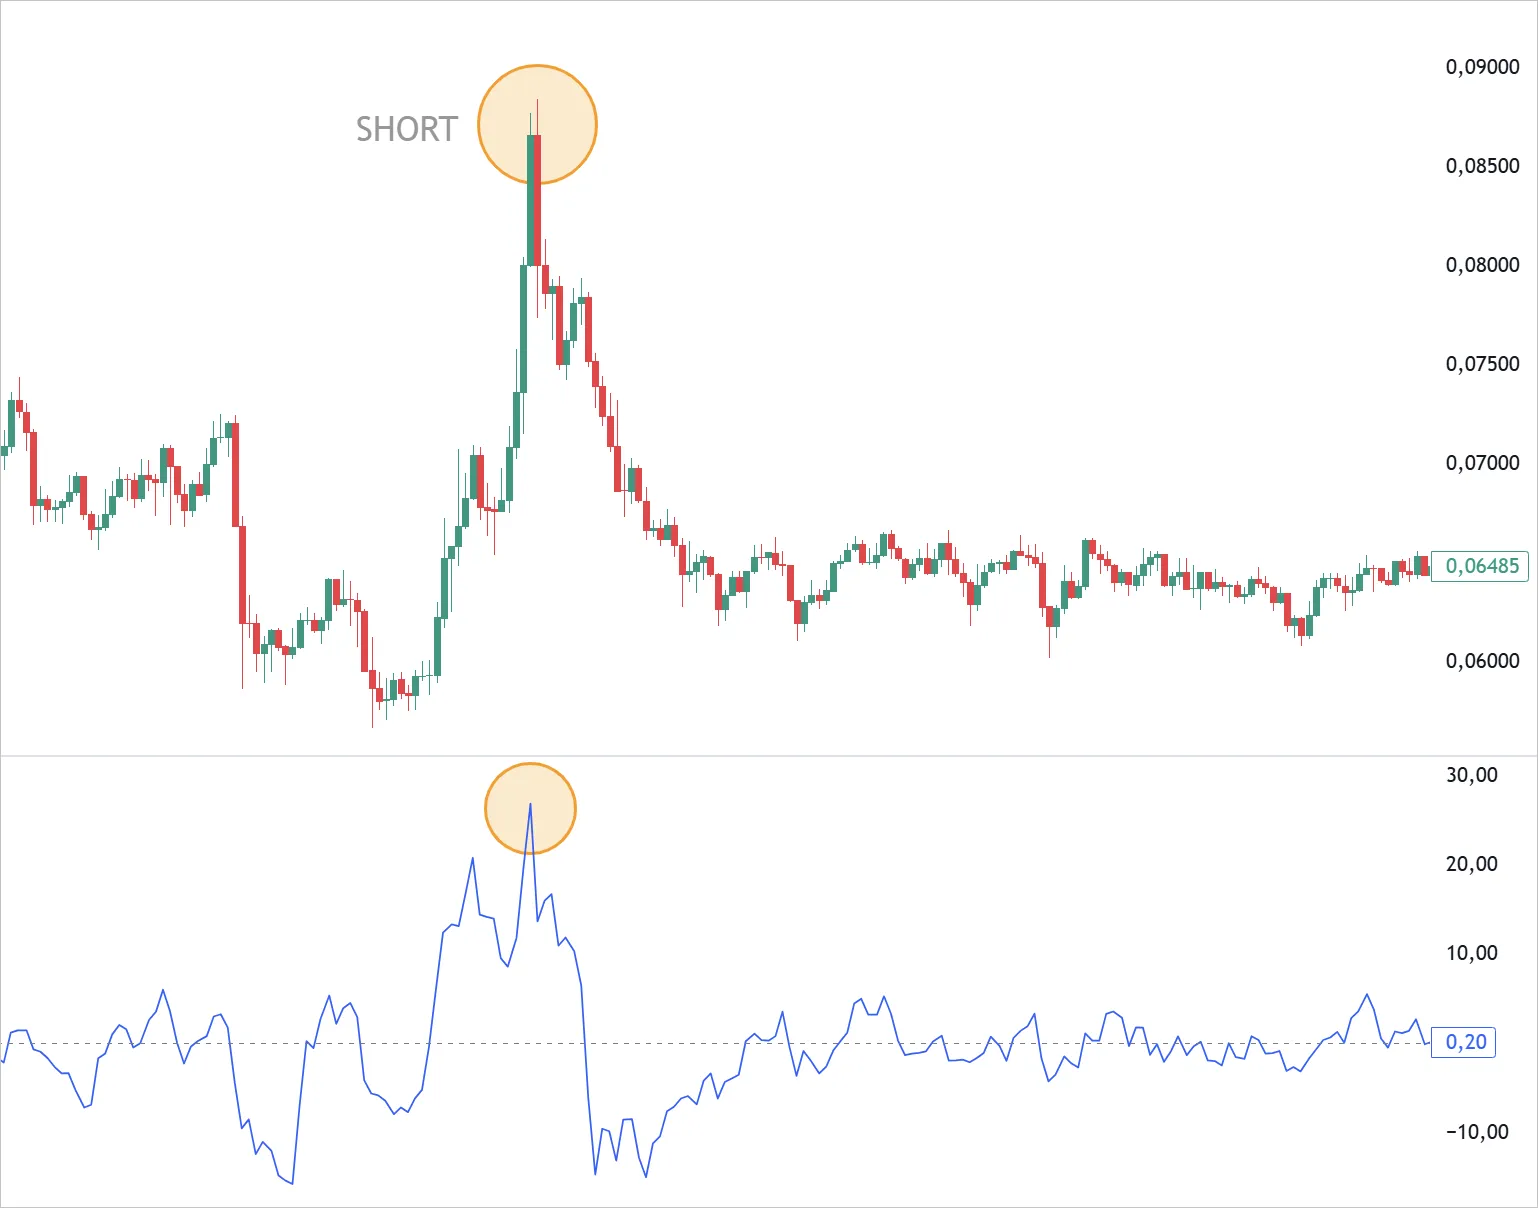
Section titled “2. Overbought and Oversold Zones”- Too high positive values may signal an overheated market (overbought)
- Too low negative values may indicate excessive selling (oversold)
3. Divergences
Section titled “3. Divergences”If the price makes a new high or low, but the ROC doesn’t confirm this, this may signal a weakening trend and a possible reversal.
4. Zero Line Crossover
Section titled “4. Zero Line Crossover”- Bottom-to-top → Buy Signal
- Top-to-bottom → Sell Signal
Usage Recommendations
Section titled “Usage Recommendations”- On short timeframes, ROC is sensitive to noise – use additional filters (e.g., SMA, EMA, RSI)
- On higher timeframes, the indicator better displays global trends
- Works effectively in conjunction with oscillators (RSI, MACD) and trend indicators to filter out false signals
This indicator is available under the name “ROC” in the Veles platform’s indicator list.
Limitations
Section titled “Limitations”- ROC is sensitive to individual price spikes — a single outlier candle can distort the signal significantly.
- On short timeframes, the indicator generates considerable noise; additional filters are essential.
- The fixed 9-candle period on the Veles platform may not be optimal for all assets or timeframes.
Summary
Section titled “Summary”The Rate of Change indicator provides a straightforward percentage-based view of price momentum. With a fixed 9-candle period in Veles, it is best used alongside trend indicators or oscillators to confirm entry timing and filter out low-conviction moves.