Relative Volatility Index (RVI)
RVI (Relative Volatility Index) — an oscillator that ranges from 0 to 100, introduced by Donald Dorsey. It looks similar to RSI, but instead of measuring price strength, it measures the balance of volatility between upward and downward movements, using standard deviation of price changes rather than the changes themselves.
- When RVI is high (dominance of “upside volatility”) — the market tends to continue rising or is overbought.
- When RVI is low (dominance of “downside volatility”) — the market tends to decline or is oversold.
How it’s calculated (intuitively)
Section titled “How it’s calculated (intuitively)”- For each bar, calculate the price change (
Close - Close[1]). - Separate the bars into “up” and “down” groups.
- Compute the moving standard deviation (StdDev) separately for “up” and “down” bars over period
N(commonly 14). - Convert these into percentage “relative volatility strength” and normalize it into a 0–100 range, similar to RSI.
The result is an oscillator showing which side of the market currently generates greater volatility.
Interpretation and levels
Section titled “Interpretation and levels”| Zone / Event | Meaning |
|---|---|
| RVI > 60 | Dominance of “upside volatility”; bullish impulse, possible overbought |
| RVI < 40 | Dominance of “downside volatility”; bearish impulse, possible oversold |
| Crossing 50 level | Shift in dominance (bulls ↔ bears) |
| Trend filter (ADX / MA) | Combining RVI with trend filters helps reduce false entries |
Typical signals
Section titled “Typical signals”| Signal type | Condition | Interpretation |
|---|---|---|
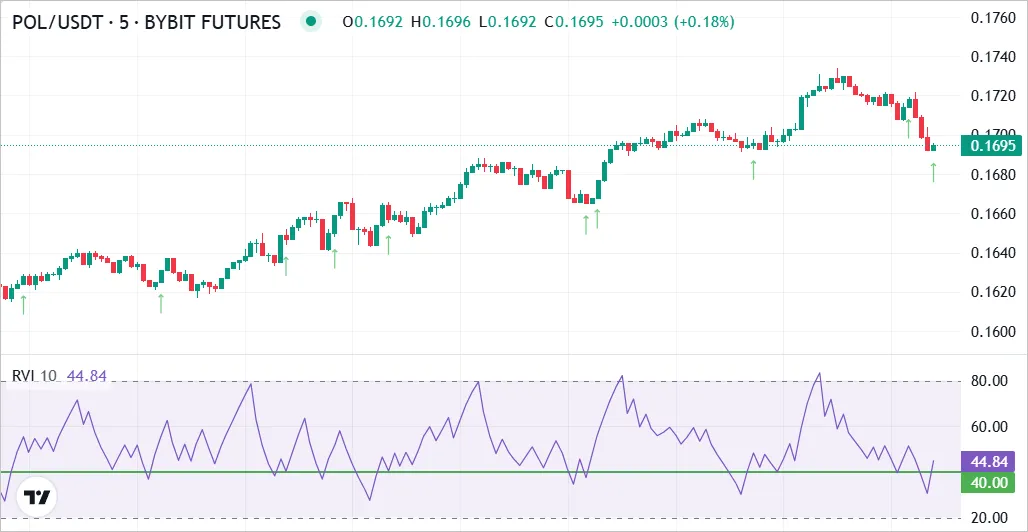
| Breakout upward (Long bias) | RVI crosses 40 from below | Early entry on rebound |
| Long confirmation | RVI stays above 50 | Trend continuation filter |
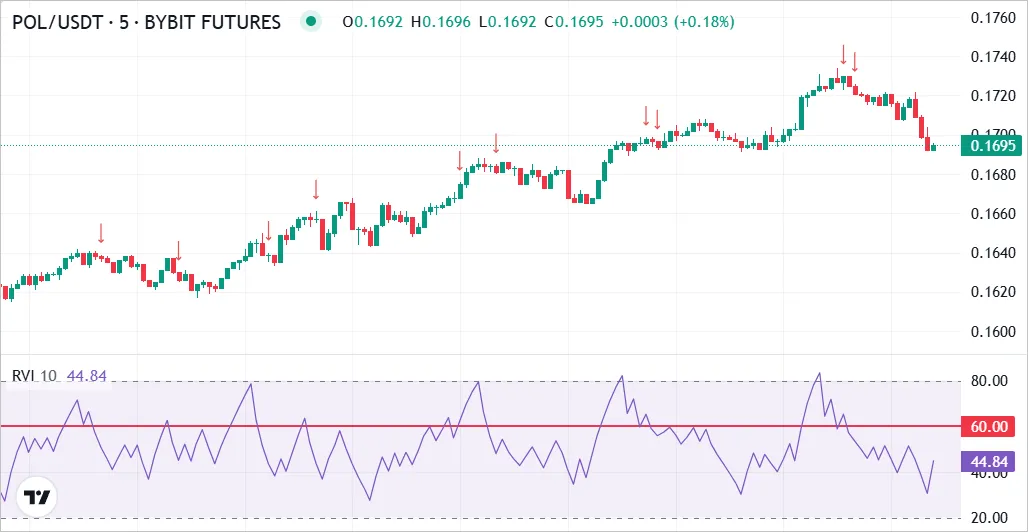
| Breakdown (Short bias) | RVI crosses 60 from above | Early sign of weakness |
| Short confirmation | RVI stays below 50 | Trend continuation filter |
Indicator “RVI Levels”
Section titled “Indicator “RVI Levels””On the Veles.Finance platform, a simplified filter called “RVI Levels” is available. It automatically generates trading signals without requiring any manual level setup.
The logic is simple:
-
When RVI crosses 40 from below, it triggers a Long signal.
-
When RVI crosses 60 from above, it triggers a Short signal.
Thus, the “RVI Levels” filter provides precise entry signals following short-term momentum and can be used for:
- bot start conditions,
- order entry filters,
- or exit triggers (in the Profit → Signal block).
Using RVI in Veles Bots
Section titled “Using RVI in Veles Bots”The indicator is available as a filter in three sections: “Filters on Start”, “Filters on Orders”, and “Exit by Signal”.
1) Directional filter for bot start
Section titled “1) Directional filter for bot start”- Open the bot editor → Filters → Add Filter → RVI.
- Timeframe: 15m / 1h (for conservative bots) or 5m (for aggressive ones).
- Condition for Long:
RVI > 50(or after crossing 40 upward). - Condition for Short:
RVI < 50(or after crossing 60 downward).
2) Filters on averaging orders
Section titled “2) Filters on averaging orders”To avoid “catching a falling knife” during sharp dumps, add RVI-based restrictions for 2nd+ averaging orders:
- Order 2–3:
RVI (15m) > 35— soft protection against buying into a dump. - Order 4+ (deep):
RVI (5m)forms a bottom and starts rising, OR crosses 40 upward.
This increases the chance of averaging closer to the actual reversal rather than on the way down.
3) Exit by signal (Profit → “Signal”)
Section titled “3) Exit by signal (Profit → “Signal”)”A clean way to close positions based on momentum change:
- Long position: close when
RVI (5–15m)crosses below 60 or falls under 50. - Short position: close when
RVIcrosses above 40 or rises above 50.
Combine with a Minimum P&L condition to avoid premature exits (e.g. ≥ 0.3–0.5%).
Combination examples
Section titled “Combination examples”- RVI + ADX (trend strength): allow RVI entries only if
ADX > 20–25— filters out sideways noise. - RVI + Bollinger Bands: enter when RVI confirms a move near the band edge for better timing.
- RVI + CCI/RSI Levels: RVI confirms the impulse while CCI/RSI highlight overbought/oversold zones.
Common mistakes and how to avoid them
Section titled “Common mistakes and how to avoid them”Summary
Section titled “Summary”The RVI (Relative Volatility Index) is a valuable tool for analyzing volatility strength and directional momentum. Combined with RVI Levels and other filters on the Veles.Finance platform, it helps bots enter more accurately, avoid false signals, and trade in harmony with real market dynamics.