Active Trade Card
When your bot opens a deal, it places orders on the exchange.
At this moment, in the Active deals section a deal card appears and a notification “Deal opened” is sent.
⚠️ Do not confuse the Deal card with the Bot card on the main page. These are different elements.
Deal Overview
Section titled “Deal Overview”The deal card can be collapsed or expanded. To expand, click the down arrow on the right.
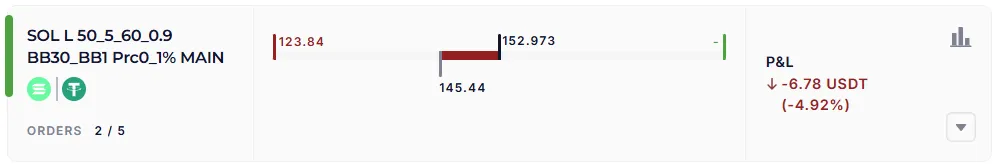
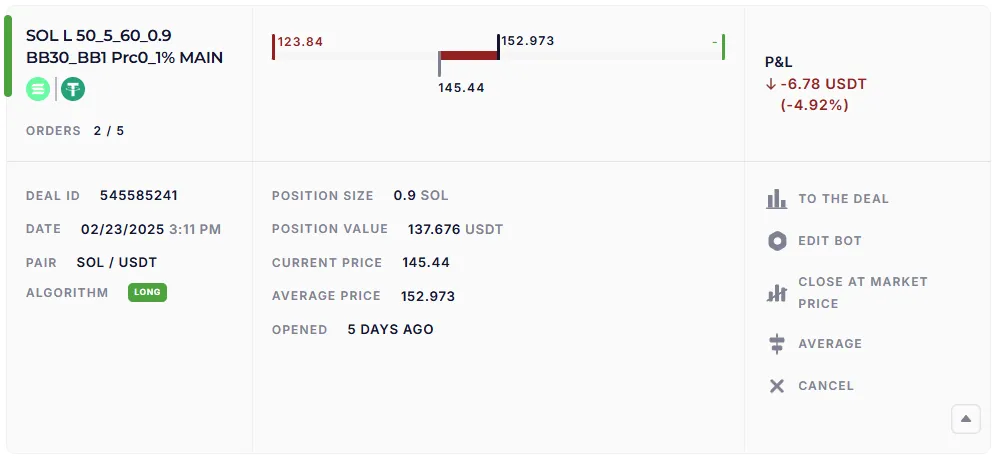
Example of an expanded card:
The left part
Section titled “The left part”- At the top is the name of the bot, the trading pair (for example, SOL/USDT), the number of executed orders (for example, 2 out of 5).
- Lower is the deal ID (unique number), date and time of entry, trading pair, algorithm (Long/Short).
The center part
Section titled “The center part”-
Price range:
- on the top in the center is the average price of the deal,
- on the top left is the price of the nearest order or Stop Loss (there will be a dash, if all the grid orders have been executed or next order will be placed by the indicator signal),
- below is the current market price.
The color of the ruler (green/red/gray) shows the PnL of the deal.
-
Under the line:
- deal volume in the base currency (for example, 0.98),
- nominal value in USDT (for example, 137.676),
- current asset price,
- the average price in the deal,
- for how long has the deal been open.
The right part
Section titled “The right part”- On top is the current PnL (profit/loss) in absolute and percentage terms.
- Lower — control buttons:
| Button | Function |
|---|---|
| To the deal | open a separate page of the deal with the chart and orders |
| Edit bot | go to the bot editor |
| Close at market price | close the deal immediately with a market order |
| Average | add an averaging order (if no Take Profit has already been executed) |
| Cancel | cancel the deal of the bot (remove all the orders, position remains on the exchange) |
Chart of the deal
Section titled “Chart of the deal”The “To the deal” button opens a page with a chart of the deal’s orders.
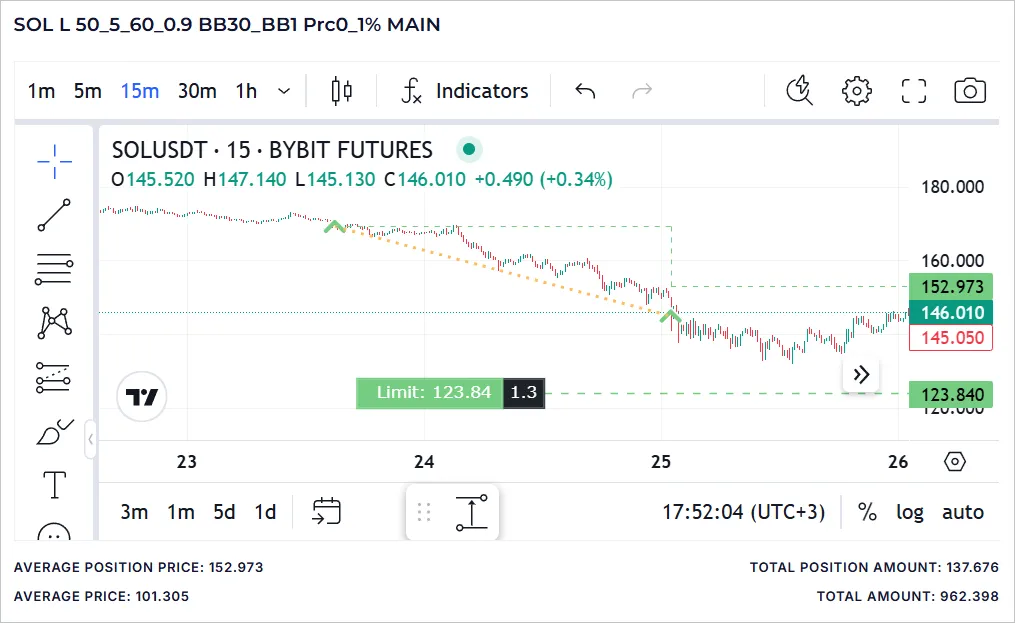
The following parameters are indicated under the graph:
- Average position price — current,
- Average price — after all orders are executed,
- Total position amount — current volume of the deal,
- Total amount — deal volume after all orders get executed.
Marks on the graph
Section titled “Marks on the graph”- Red dotted line — the price at the time of the chart opening (not updated).
- Green arrows — buy orders (Long).
- Red arrows — sell orders (Short or Take Profits in Long).
- Yellow dotted lines — the connection of orders within the deal.
- The green dashed line with steps — the average deal price after each averaging.
Order statuses
Section titled “Order statuses”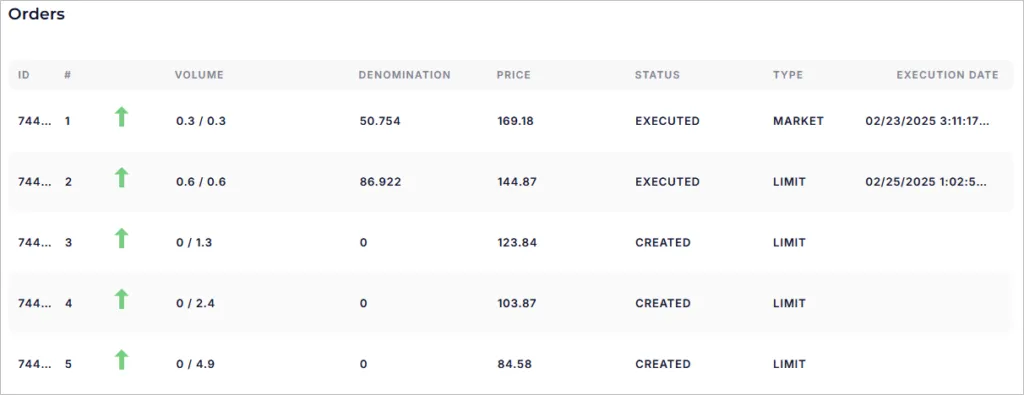
- Position — the old position, discovered on the trading account and included in the deal.
- Executed — the order was triggered, marked with an arrow.
- Created — listed on the exchange, but not yet executed.
- Pending — scheduled by the bot, but not created yet.
- Liquidated — the exchange cancelled the order (for example, a Stop Loss). You need to check your trading history on the exchange.
Important for beginners
Section titled “Important for beginners”- The active deal card is your control tool.
- You can see here: entry price, current profit/loss, averages, take profits.
- Using the buttons, you can manually manage the deal: close it, average or cancel.
- The chart helps to visually track where and how the bot placed orders.