Indicator Selection
Indicator Selection is a tool that, with a single click, runs a multi-indicator analysis of a single-order bot for the selected trading pair and timeframe. It determines which popular indicator would have delivered the best results on the last 1500 candles when trading exclusively on its signals (entry and exit according to the indicator’s standard logic).
The system evaluates performance for long and short separately and returns two results. If no profitable strategy is found, no result is shown.
The tool is available in two places:
- In the bot configurator on veles.finance
- In the terminal at beta.veles.finance
What Bot Is Analyzed
Section titled “What Bot Is Analyzed”- Leverage ×1, trading with a single order
- Entry based on the standard indicator from the list (default values)
- Exit based on the same standard indicator (default values), “Minimum PnL” disabled
- Testing period: last 1500 candles of the current timeframe (selected on the TradingView chart)
Indicators for Testing
Section titled “Indicators for Testing”- Balance of Power
- Bollinger Bands
- CCI Levels (Commodity Channel Index)
- Chaikin Oscillator
- CMO Levels (Chande Momentum Oscillator)
- Donchian Channel
- EMA 500 cross EMA 100 (Exponential Moving Average)
- Fast Stochastic, line crossover
- Fast Stochastic, levels
- Stochastic, line crossover (slow)
- Stochastic, levels (slow)
- Hull Moving Average
- Keltner Channel
- MACD and signal line crossover
- MACD and zero level crossover
- Trend by MACD histogram
- Mean Reversion Channel: Middle levels
- Mean Reversion Channel: Strong levels
- Mean Reversion Channel: Weak levels
- MFI midrange crossover (Money Flow Index)
- MFI Levels (Money Flow Index)
- SAR trend reversal
- SAR trend
- RoC and zero level crossover (Rate of Change)
- RSI Levels (Relative Strength Index)
- RVI Levels (Relative Volatility Index)
- SrgArt DiverX
- SuperTrend reversal
- SuperTrend trend
- Turtle Zone
- VMC Divergence (VuManChu Divergence)
- VMC Money Flow (VuManChu Money Flow)
- VMC Wave Trend (VuManChu Wave Trend)
- %R Levels (Williams %R)
Subscription Limitations
Section titled “Subscription Limitations”Indicator Selection consumes your subscription’s backtest quota:
- Basic subscription — 10 backtests (shared counter for regular backtests and indicator selection).
- PRO subscription — unlimited.
Each Indicator Selection run uses 1 backtest from the quota.
What Data the Tool Displays
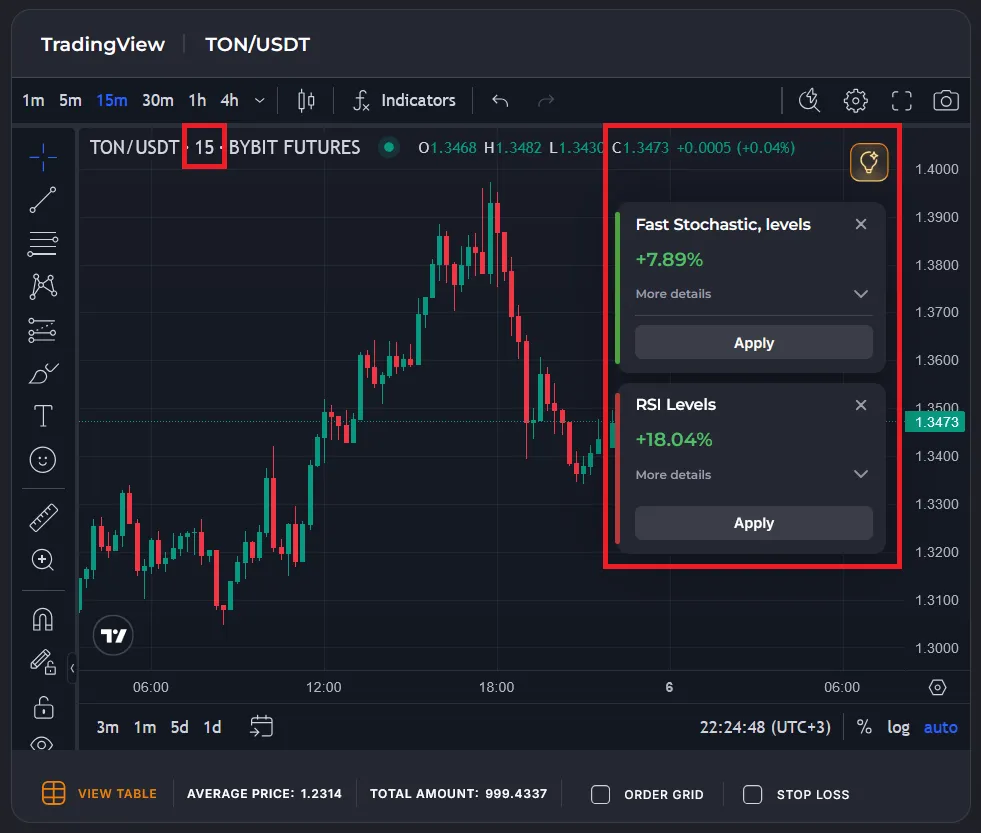
Section titled “What Data the Tool Displays”After calculation completes, cards with the best-performing indicators are shown (separately for long and short).
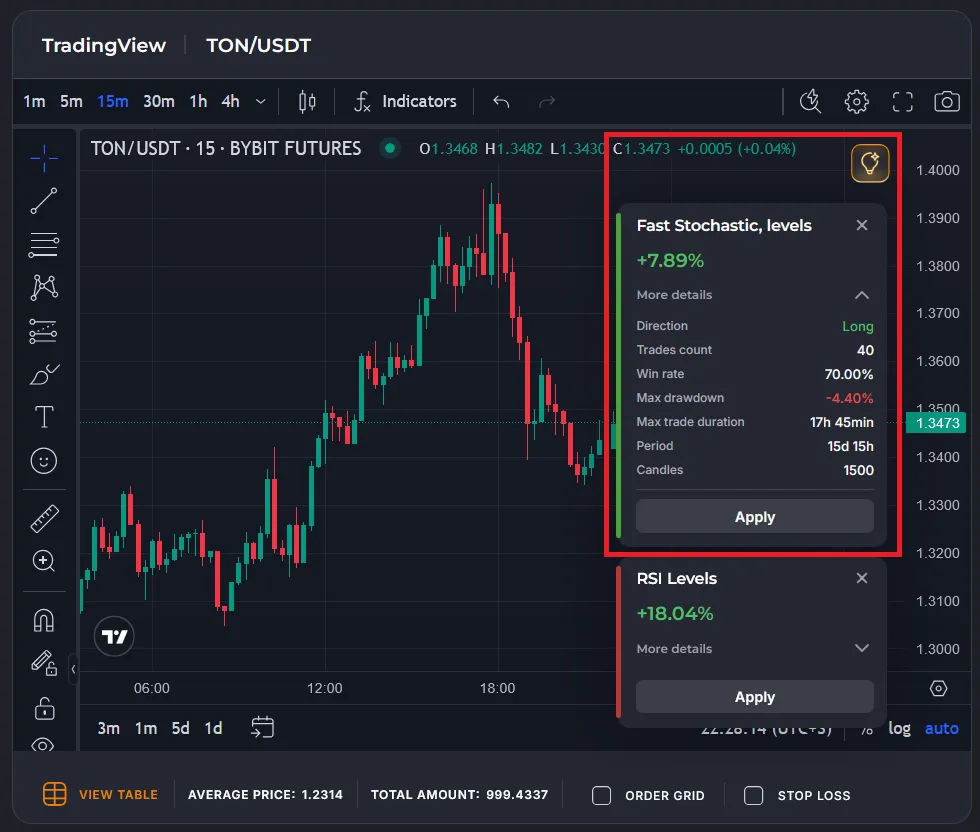
Each card includes:
- Indicator name
- Final PnL (profitability at ×1 leverage)
- Direction (Long / Short)
- Number of trades
- Win rate (% profitable trades)
- Maximum drawdown
- Maximum time in trade
- Testing period (total time over the last 1500 candles of the selected timeframe)
After clicking “Apply”:
- The selected indicator is added to the chart
- All entry and exit points based on its signals are displayed
How It Can Be Useful
Section titled “How It Can Be Useful”-
Quickly select an indicator for trading
Identify which popular indicator performed best on your pair and timeframe over the last 1500 candles. This is an excellent starting point for bot configuration or manual trading. -
Evaluate real historical performance
Review key metrics:- How many trades the indicator generated
- What the win rate was
- How deep the maximum drawdown reached
- How long positions were held
-
Compare long and short separately
The tool shows in which direction (long or short) the indicator worked more effectively on the selected asset and timeframe.
How to Use
Section titled “How to Use”- Open the bot configurator or the beta.veles.finance terminal.
- Select the trading pair and timeframe.
- Launch “Indicator Selection” (the lightbulb button or the menu section).
- Wait for the calculation to finish (usually a few seconds, depending on load).
- Expand and review the result cards (sorted by PnL).
- Click “Apply” on the desired indicator — it will be instantly added to the chart with entry/exit points.
To set up the bot in strict accordance with the recommended strategy, create a bot with a single order, add the indicator to the entry filters and profit filters (“Signal” mode), and do not enable the minimum PNL check.
For example, here’s a bot template for the 1INCH/USDT trading pair with the “RSI Levels” filter for long trading on a 15-minute timeframe:
https://veles.finance/share/Jyxfi
Recommendations
Section titled “Recommendations”- Use auto-selection as a starting point, not the final decision.
- Always add additional filters (ATR%, Candle Trend, RSI, etc.) to reduce false signals.
- Verify results with a full backtest across different periods and assets — markets change.
- If an indicator shows a negative result — it is better to discard it for that strategy.
Summary
Section titled “Summary”Indicator Selection is a fast and convenient way to understand which indicators “like” your asset and timeframe right now. It saves time on manually testing dozens of combinations and helps quickly discover working ideas for bots and manual trading.