Arnaud Legoux Moving Average (ALMA)
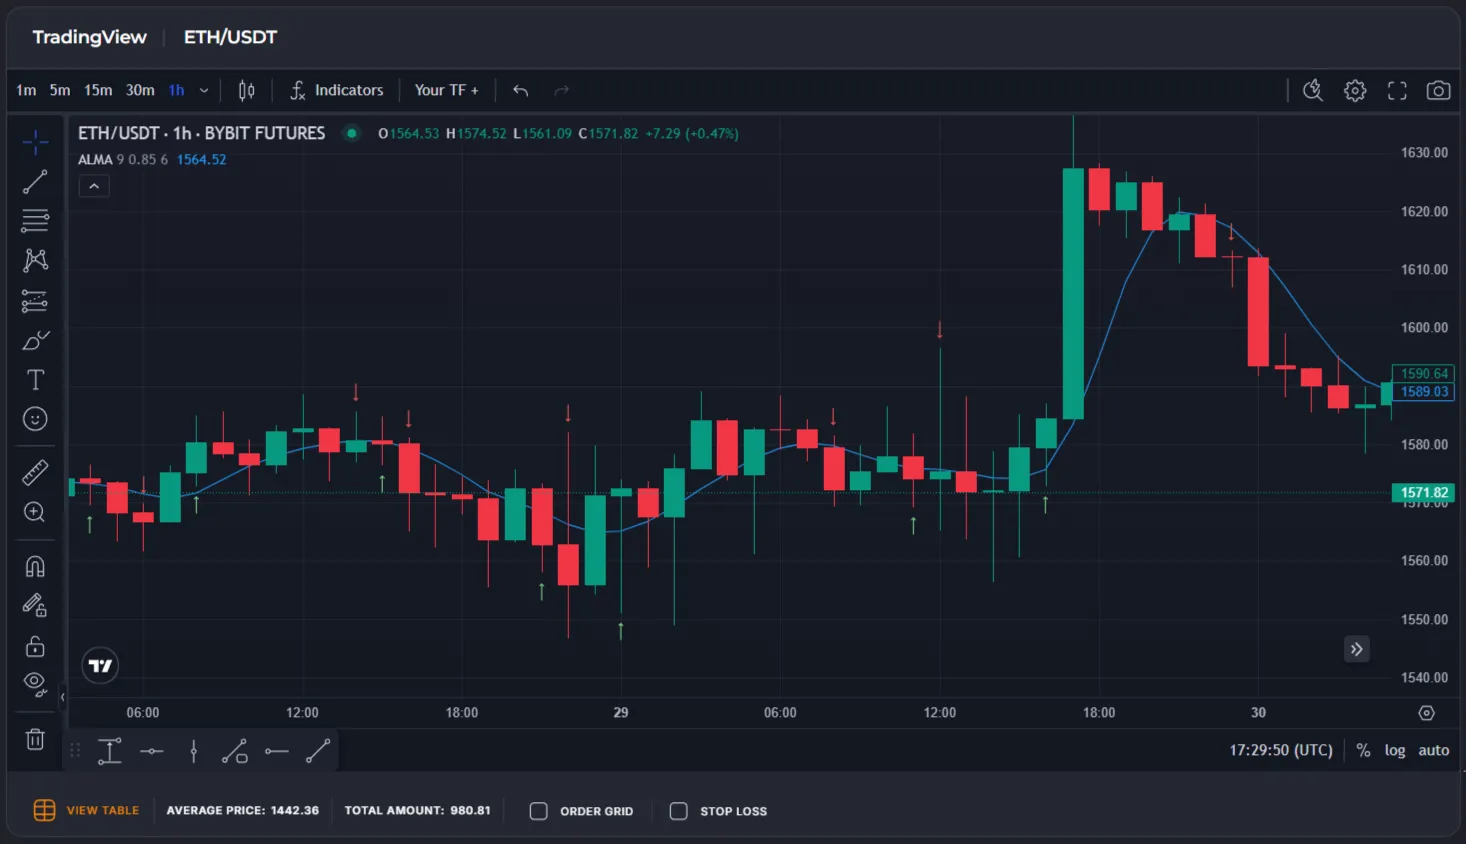
Arnaud Legoux Moving Average (ALMA) is a moving average with a Gaussian weight distribution, designed to minimize lag while keeping the line smooth. Unlike WMA or EMA, ALMA provides fine-grained control over the position of the weight “center of gravity” and the smoothing intensity through two parameters — Offset and Sigma.
Trend Detection with ALMA
Section titled “Trend Detection with ALMA”ALMA is used in the same way as other moving averages — by comparing it to the current closing price:
- Price above the ALMA line → buy signal (long).
- Price below the ALMA line → sell signal (short).
🔵 Due to its Gaussian weights, ALMA forms a smoother line than EMA or WMA at a comparable period, which reduces false crossings during sideways price action.
ALMA / Price Crossover
Section titled “ALMA / Price Crossover”When the current price crosses the ALMA line, it may signal a local trend change:
- Cross from above to below → signal to open a short position.
- Cross from below to above → signal to open a long position.
The Offset parameter concentrates the Gaussian curve toward the most recent candles, so at values close to 1, crossovers occur earlier than with SMA or SMMA — reducing signal lag.
Calculation Formula
Section titled “Calculation Formula”ALMA is calculated as a weighted sum of closing prices over the last Length candles, where each weight is determined by a Gaussian function centered at a position controlled by Offset and with a width controlled by Sigma:
Weight of candle i = exp(−(i + 1 − m)² / (2 × s²))
ALMA = Σ(Close[i] × weight[i]) / Σ(weight[i])
Where m = Offset × (Length − 1), s = Length / Sigma, and i runs from 0 (oldest candle in the window) to Length − 1 (current candle).
Weights are computed once and remain constant between bars.
Parameters
Section titled “Parameters”- Offset — shifts the center of the Gaussian curve. Range: 0 to 1. At the default value of 0.85, the maximum weight is concentrated on the most recent candles — the line reacts quickly to price movements. Values close to 0 shift the center toward older data, increasing lag.
- Sigma — controls the width of the Gaussian curve. Integer, default 6. Small values (2–4) create a sharp weight peak, making ALMA more sensitive to noise. Larger values (8–12) smooth the line more but add lag.
Timeframes and Practical Application
Section titled “Timeframes and Practical Application”- On short timeframes (1m–15m), ALMA with a high
Offset(0.85–0.95) and smallSigma(4–6) generates fast signals comparable to EMA but with less noise. - On higher timeframes (4h, 1d), increasing
Sigmato 8–10 provides reliable trend tracking without excessive crossings.
👉 ALMA is most effective in trending markets. In sideways conditions, Gaussian smoothing offers limited advantage over other moving averages. Always validate parameters through backtesting.
Using ALMA in Veles Bots (Flexible Indicators)
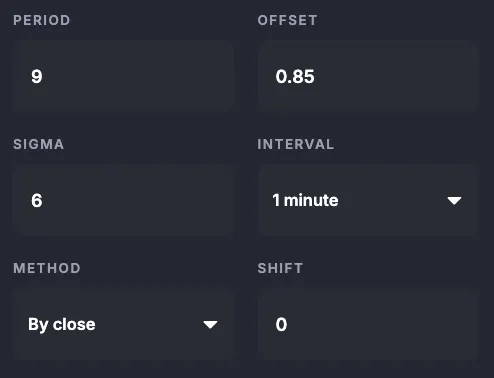
Section titled “Using ALMA in Veles Bots (Flexible Indicators)”Available settings:
- Period — the number of candles for calculation (
Lengthparameter). Range: 2–500, default value — 9. - Offset — position of the Gaussian curve center. Range: 0–1, default value — 0.85.
- Sigma — width of the Gaussian curve. Integer, default value — 6.
- Interval — candle timeframe.
- Method — calculation type. On bar close (for the selected interval only), or per minute (once per minute for any interval).
- Shift — shifts the requested indicator value back by the specified number of candles.
Limitations
Section titled “Limitations”- ALMA is a trend indicator: it shows the overall direction of price movement, not reversal points.
- At very low
Sigmavalues (1–3), ALMA becomes sensitive to price spikes — a single anomalous candle can noticeably distort the line. - For better accuracy, it is recommended to use ALMA in combination with other indicators (RSI, ATR, MACD) and support/resistance levels.
- In Veles bots, ALMA can be used as an entry or exit filter, combined with any other conditions.
Summary
Section titled “Summary”ALMA is a trend filter with Gaussian weights that produces a smoother line than EMA and WMA at a comparable period. The Offset and Sigma parameters allow flexible tuning of the balance between response speed and noise resistance without changing the period. In Veles bots, ALMA is most effective in trending markets when combined with momentum indicators such as RSI or MACD.