Smoothed Moving Average (SMMA)
Smoothed Moving Average (SMMA) is a type of moving average that incorporates the entire price history, giving equal weight to both recent and older data. Unlike EMA, SMMA reacts more slowly to price changes, forming a more stable trend line with fewer false signals.
Identifying the Trend with SMMA
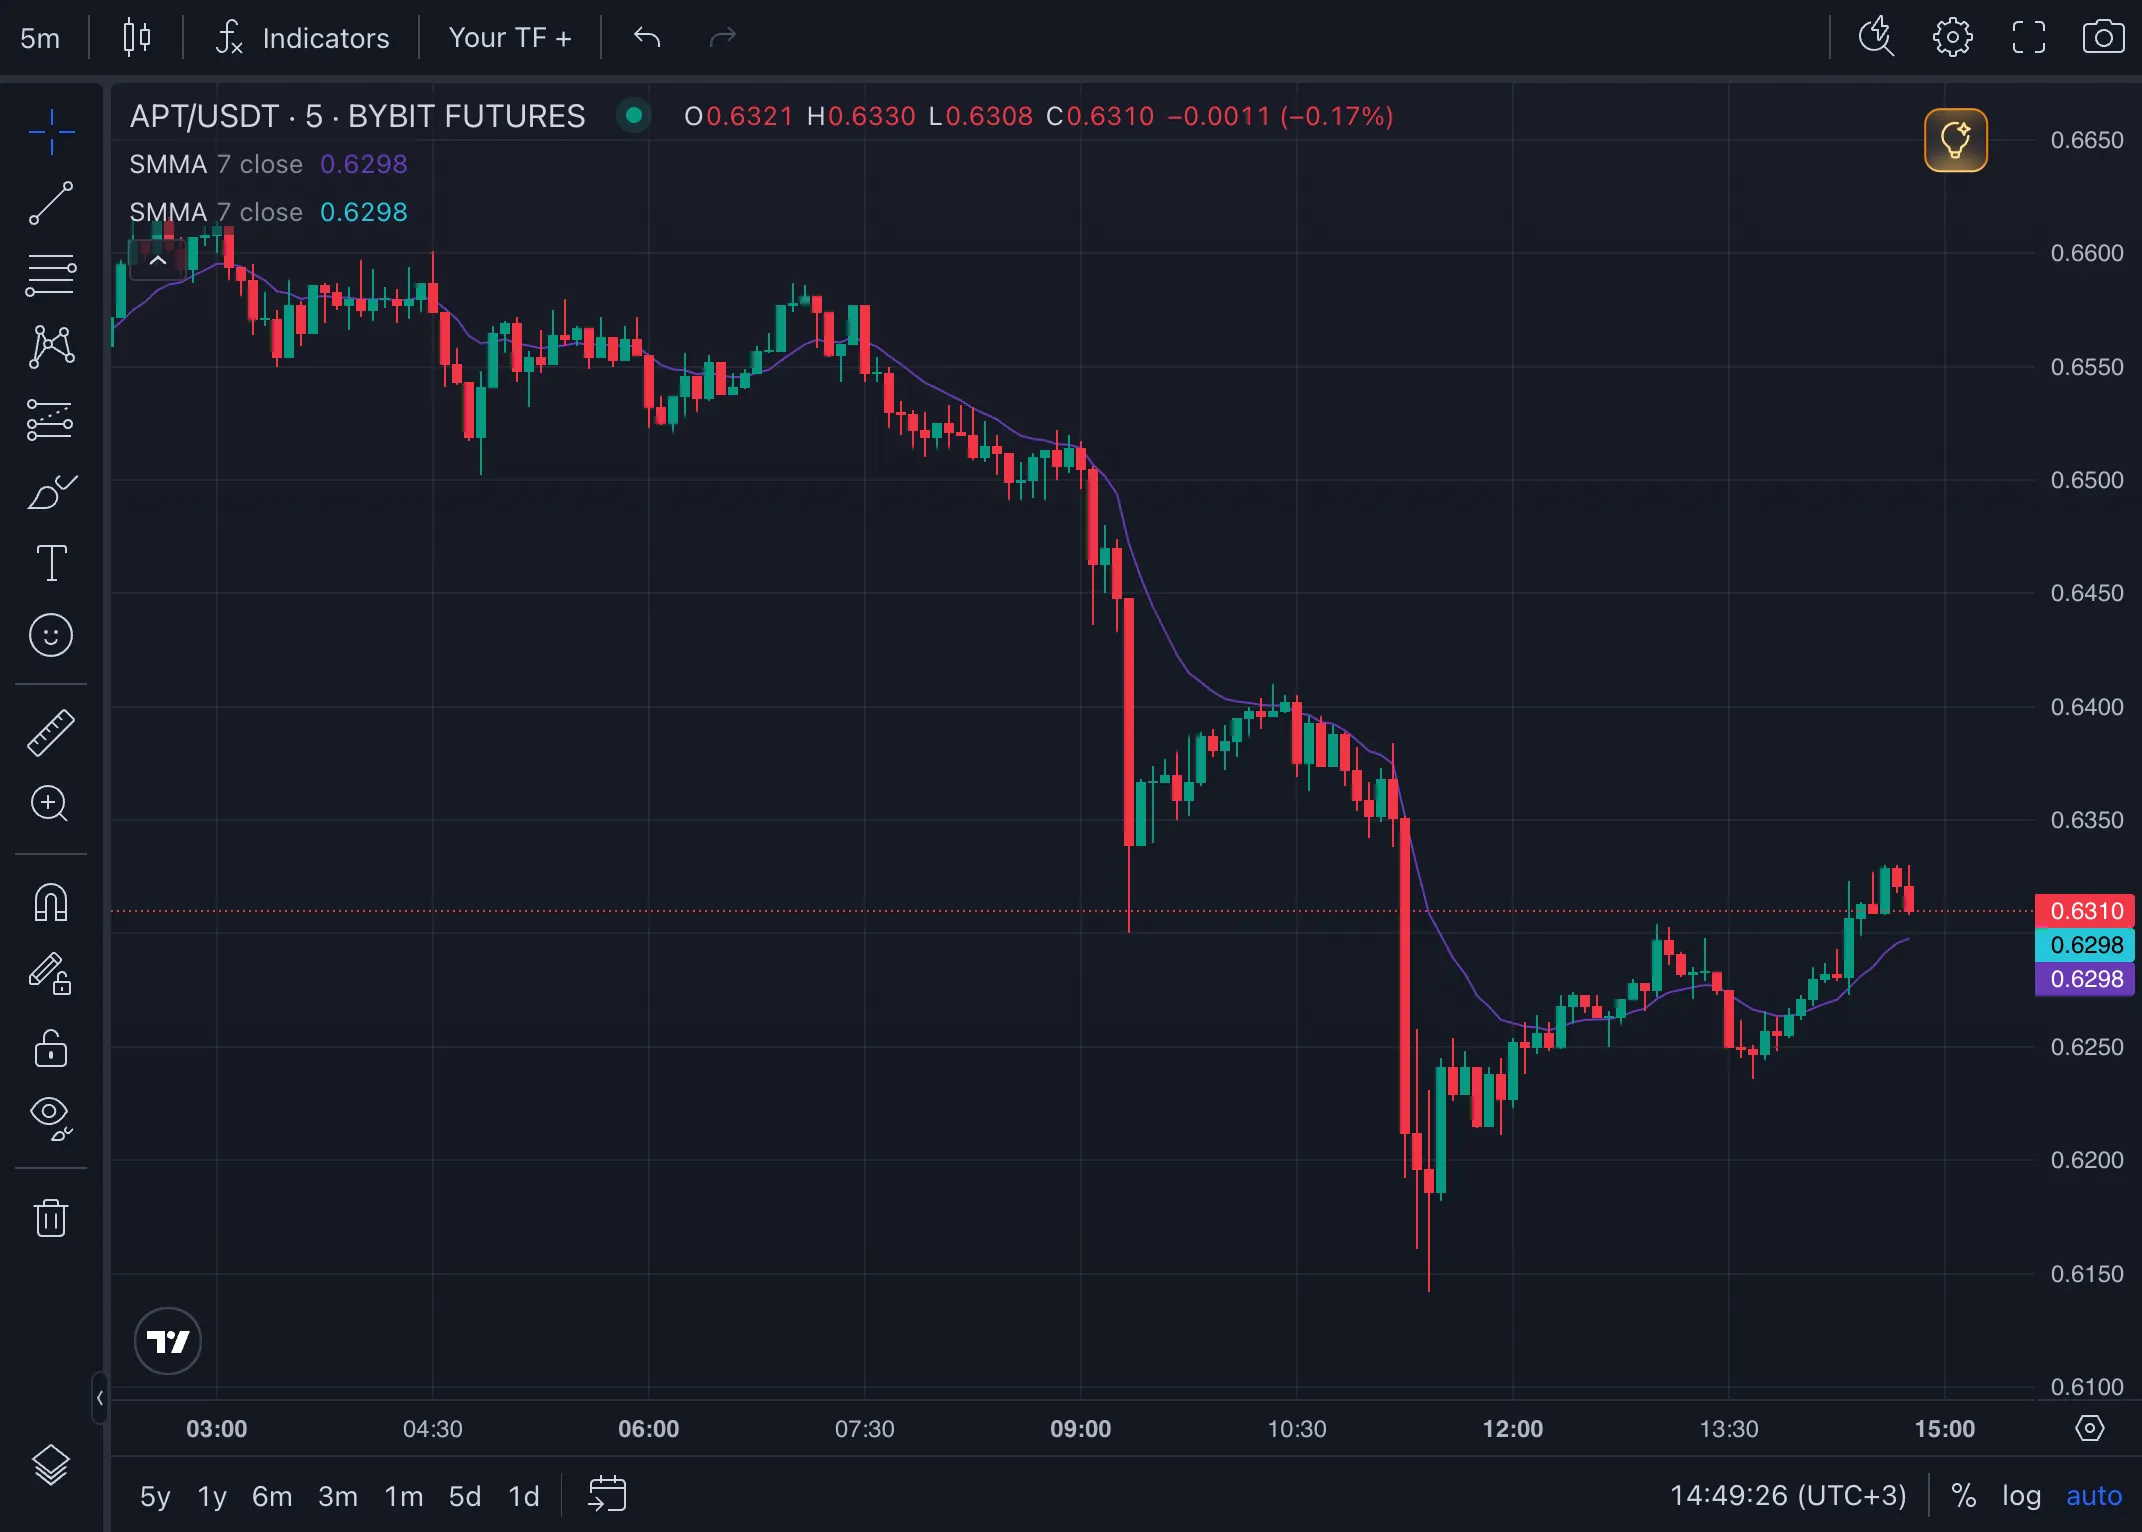
Section titled “Identifying the Trend with SMMA”The SMMA indicator is highlighted depending on whether the current price is above or below the line:
- Price above the SMMA line → buy signal (long).
- Price below the SMMA line → sell signal (short).
🔵 Thanks to its smoothing effect, SMMA works well on medium and higher timeframes by filtering out short-term noise. However, this same property causes greater lag during sharp market reversals compared to EMA.
SMMA and Price Crossover
Section titled “SMMA and Price Crossover”When the current price crosses the SMMA line, it may signal a change in the local trend:
- Crossover from above to below → signal to open a short trade.
- Crossover from below to above → signal to open a long trade.
Due to SMMA’s inertia, such crossovers occur less frequently than with EMA — this reduces the number of trades but improves their quality in trending markets.
Calculation Formula
Section titled “Calculation Formula”SMMA is calculated in two steps:
- For the first
Lengthcandles, a Simple Moving Average (SMA) is calculated — this becomes the initial indicator value. - For each subsequent candle, the following formula is applied:
SMMA(t) = (SMMA(t−1) × (Length − 1) + Close) / Length
Where SMMA(t−1) is the value from the previous candle, Length is the chosen period, and Close is the current candle’s closing price.
Timeframes and Practical Use
Section titled “Timeframes and Practical Use”- On shorter timeframes, SMMA’s lag becomes more pronounced — signals may arrive too late to be useful.
- On higher timeframes (4h, 1d), SMMA generates reliable trend signals with minimal noise.
👉 SMMA is most effective in trending markets. In sideways (ranging) conditions, it — like all trend indicators — generates frequent false signals. Always validate your strategy through backtesting.
Use in Veles Bots (Flexible Indicators)
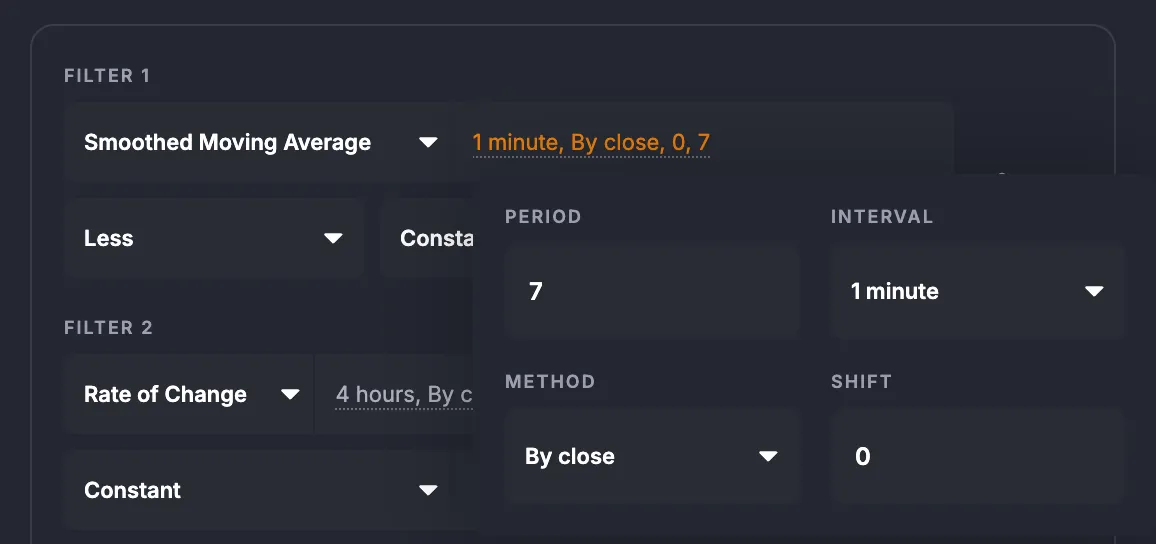
Section titled “Use in Veles Bots (Flexible Indicators)”Available settings:
- Period — number of candles used for calculation. Range: 2–500, default value — 7.
- Interval — candle timeframe.
- Method — calculation type. By bar close (on the selected interval only), or by minute (every minute for any interval).
- Shift — offsets the requested indicator value by a specified number of candles back.
Limitations
Section titled “Limitations”- SMMA is a trend indicator that shows the general direction of price movement, not reversal points.
- Due to its smoothing, SMMA lags more than EMA — during sharp price moves, entries may be less precise.
- For better accuracy, it is recommended to use SMMA in combination with other indicators (RSI, MACD, ATR) and support/resistance levels.
- In Veles bots, SMMA can be used as an entry or exit filter, combined with any other conditions.
Summary
Section titled “Summary”SMMA is a slow-reacting trend filter that produces a smoother line than EMA. In Veles bots, it helps filter out short-term market noise and supports strategies focused on sustained trends. Most effective on 4h timeframes and above, in combination with momentum indicators such as RSI or MACD.