Least Squares Moving Average (LSMA)
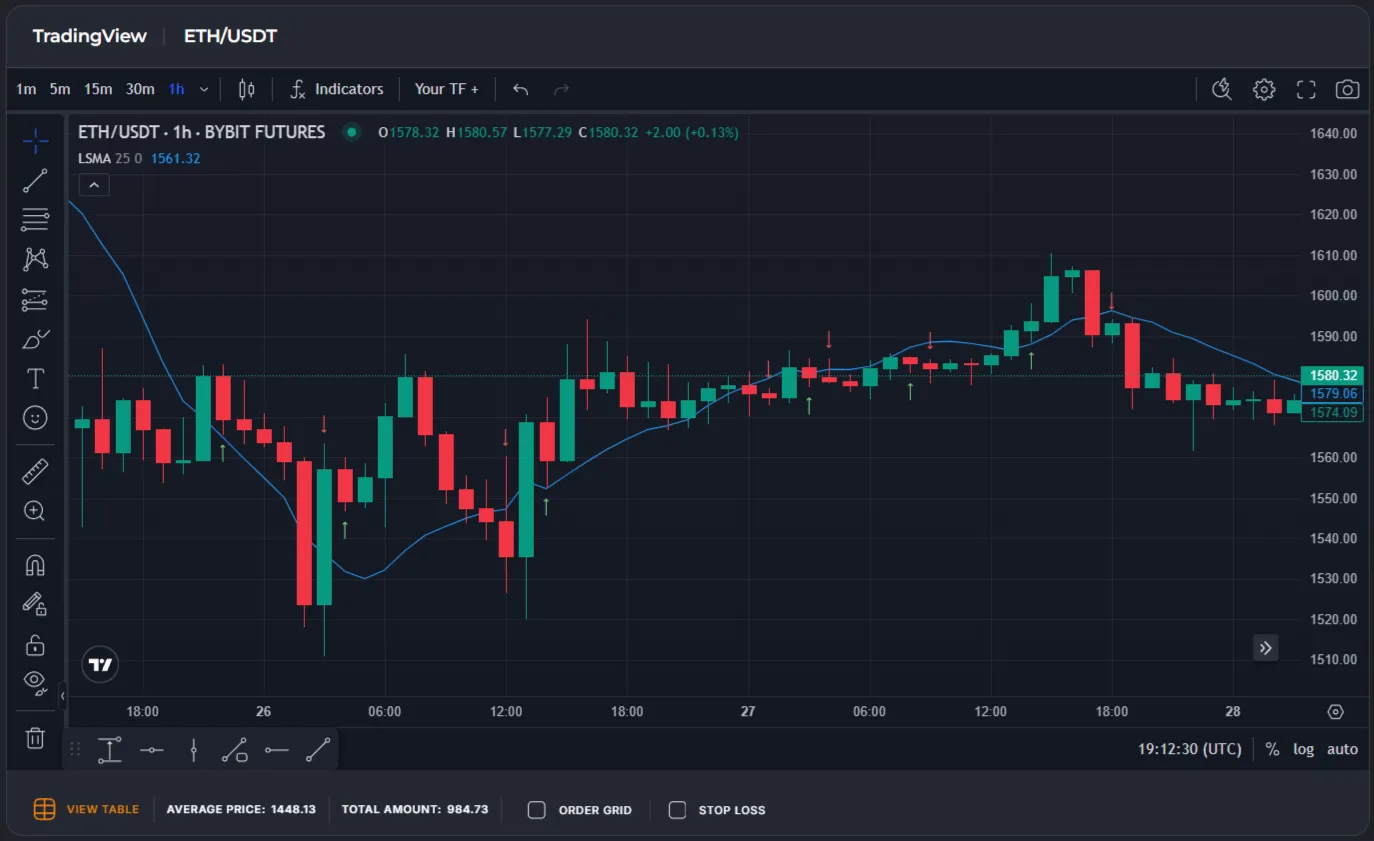
Least Squares Moving Average (LSMA) is a moving average built on linear regression: for each window of Length candles, a straight line is fitted to closing prices by minimizing the sum of squared deviations. Unlike WMA or EMA, LSMA does not simply weight prices — it approximates the price trend with a mathematically precise line.
Trend Detection with LSMA
Section titled “Trend Detection with LSMA”LSMA is used in the same way as other moving averages — by comparing it with the current closing price:
- Price above the LSMA line → buy signal (long).
- Price below the LSMA line → sell signal (short).
🔵 Thanks to its regression foundation, LSMA describes the trend more smoothly than WMA and better filters out short-term noise — while remaining responsive to genuine trend moves.
LSMA Crossovers with Price
Section titled “LSMA Crossovers with Price”When the current price crosses the LSMA line, it may signal a local trend reversal:
- Cross from above to below → signal to open a short position.
- Cross from below to above → signal to open a long position.
The regression nature of LSMA produces a smoother line than WMA — crossovers occur less frequently but with fewer false signals on trending market segments.
Calculation Formula
Section titled “Calculation Formula”For a window of Length candles, a linear regression y = slope × (x − offset) + intercept is computed, where y[i] are closing prices and x[i] are integer indices from 1 to Length.
First, compute the auxiliary sums:
x_sum = Σ xᵢ
y_sum = Σ yᵢ
xy_sum = Σ xᵢ × yᵢ
x2_sum = Σ xᵢ²
Then derive the regression parameters:
slope = (Length × xy_sum − x_sum × y_sum) / (Length × x2_sum − x_sum²)
intercept = (y_sum − slope × x_sum) / Length
The final LSMA value for the current candle:
LSMA = slope × (Length − offset) + intercept
Timeframes and Practical Use
Section titled “Timeframes and Practical Use”- On short timeframes (1m–15m) LSMA produces smoother signals compared to WMA, reducing false triggers in scalping strategies.
- On higher timeframes (4h, 1d) the regression line reliably reflects the medium-term trend, especially with
Lengthvalues between 20 and 50.
👉 LSMA works best on clearly trending markets. In sideways (flat) conditions, the regression still tries to fit a “best line” through horizontal prices — this leads to false signals. Always validate your strategy through backtesting.
Using LSMA in Veles Bots (Flexible Indicators)
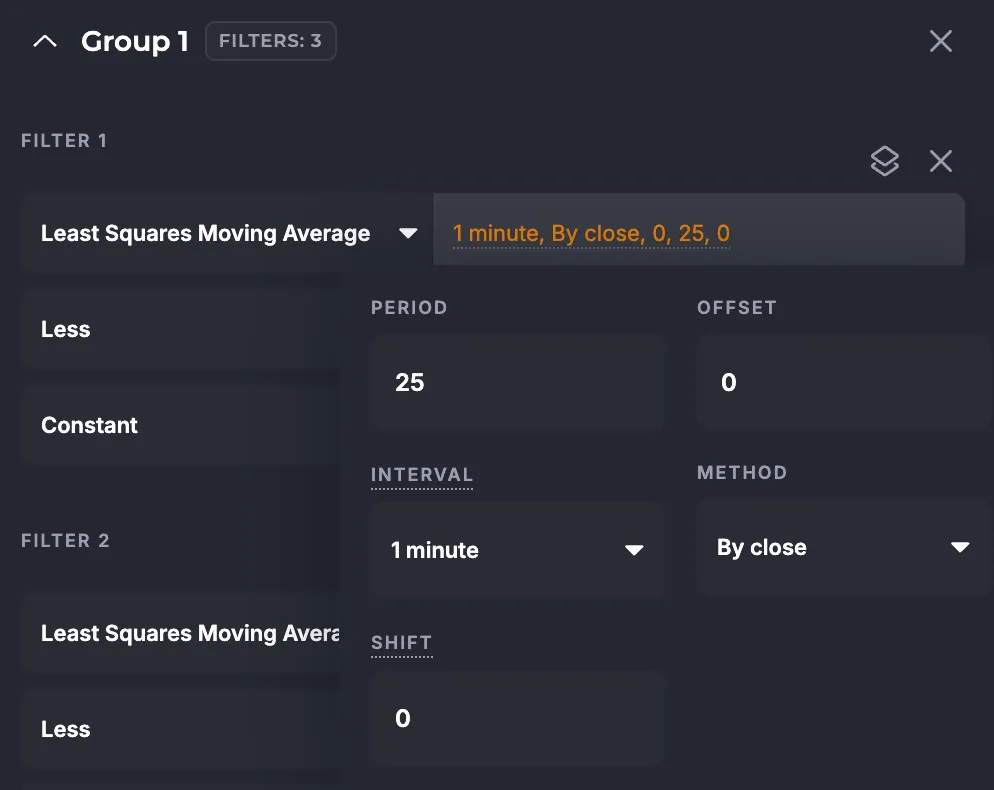
Section titled “Using LSMA in Veles Bots (Flexible Indicators)”Available settings:
- Period (Length) — number of candles used in the regression calculation. Range: 3–500, default value — 25.
- Offset — shifts the evaluation point along the regression line. Range: 0–10, default — 0 (end of the line, most recent point).
- Interval — candle timeframe.
- Method — calculation type: on bar close (only at the selected interval) or per minute (every minute for any interval).
- Bar shift — offsets the requested indicator value by a given number of candles back.
Limitations
Section titled “Limitations”- LSMA is a trend indicator: it describes the direction of price movement, not reversal points.
- The regression line assumes a linear trend within the
Lengthwindow — accuracy drops on non-linear or choppy price segments. - Increasing
Lengthmakes the line smoother but adds signal lag; decreasing it has the opposite effect. - A non-zero
offsetshifts the evaluation point backward in time, which can be useful for trend confirmation but increases lag. - For better accuracy, it is recommended to use LSMA in combination with other indicators (RSI, ATR, MACD) and support/resistance levels.
Summary
Section titled “Summary”LSMA is a regression-based trend filter that provides mathematically grounded smoothing of price data. In Veles bots, it enables strategies with fewer false crossovers compared to WMA and EMA. It performs best on trending markets when combined with momentum indicators such as RSI or MACD.