Weighted Moving Average (WMA)
Weighted Moving Average (WMA) is a moving average with linear weights, where each successive candle carries a higher weight than the previous one. Unlike EMA or SMMA, WMA explicitly prioritizes recent data through a fixed linear weight scale.
Trend Identification with WMA
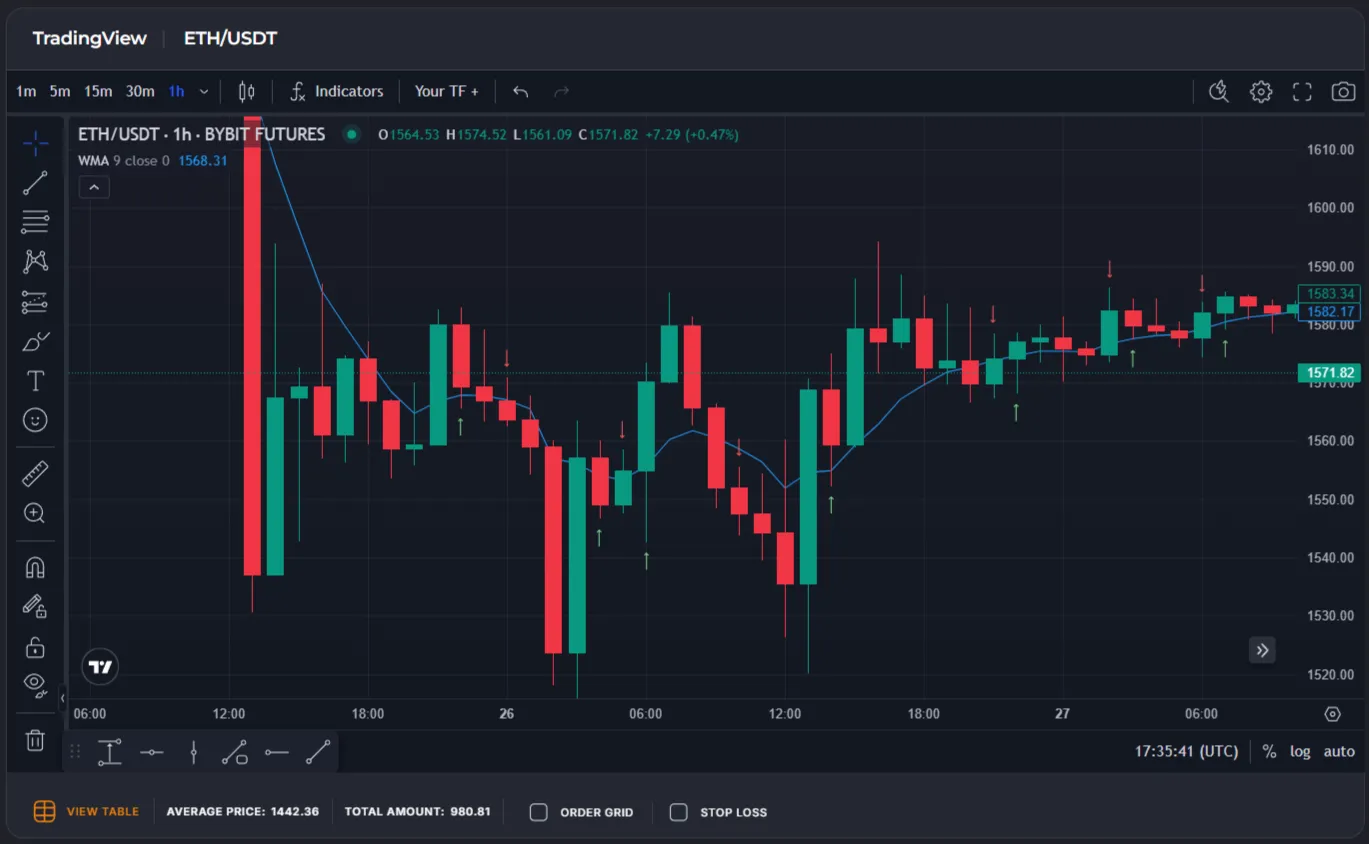
Section titled “Trend Identification with WMA”WMA is used like other moving averages — by comparing it to the current closing price:
- Price above the WMA line → buy signal (long).
- Price below the WMA line → sell signal (short).
🔵 Thanks to linear weights, WMA reacts to price changes faster than SMMA or SMA, but slower than a short-period EMA. This makes it a good balance between responsiveness and noise resistance.
WMA Price Crossover
Section titled “WMA Price Crossover”When the current price crosses the WMA line, it may signal a local trend change:
- Crossover from above downward → signal to open a short position.
- Crossover from below upward → signal to open a long position.
Because WMA gives the highest priority to the most recent candles, crossovers occur earlier than with SMMA — reducing signal lag on trending moves.
Calculation Formula
Section titled “Calculation Formula”WMA is calculated as a weighted sum of closing prices over the last Length candles, where each candle’s weight increases linearly from 1 (oldest) to Length (most recent):
WMA = Σ(Close[i] × i) / Length × (Length + 1) / 2
Where i is the candle’s sequential number from 1 (oldest in the window) to Length (current), and Length × (Length + 1) / 2 is the sum of all weights.
Timeframes and Practical Use
Section titled “Timeframes and Practical Use”- On short timeframes (1m–15m), WMA provides more responsive signals than SMMA, which is useful for scalping strategies.
- On higher timeframes (4h, 1d), linear weights deliver reliable trend tracking with less lag than SMA.
👉 WMA works best on trending markets. In sideways (flat) conditions, linear weighting offers no advantage — the indicator will still generate false signals. Always validate your strategy with a backtest.
Use in Veles Bots (Flexible Indicators)
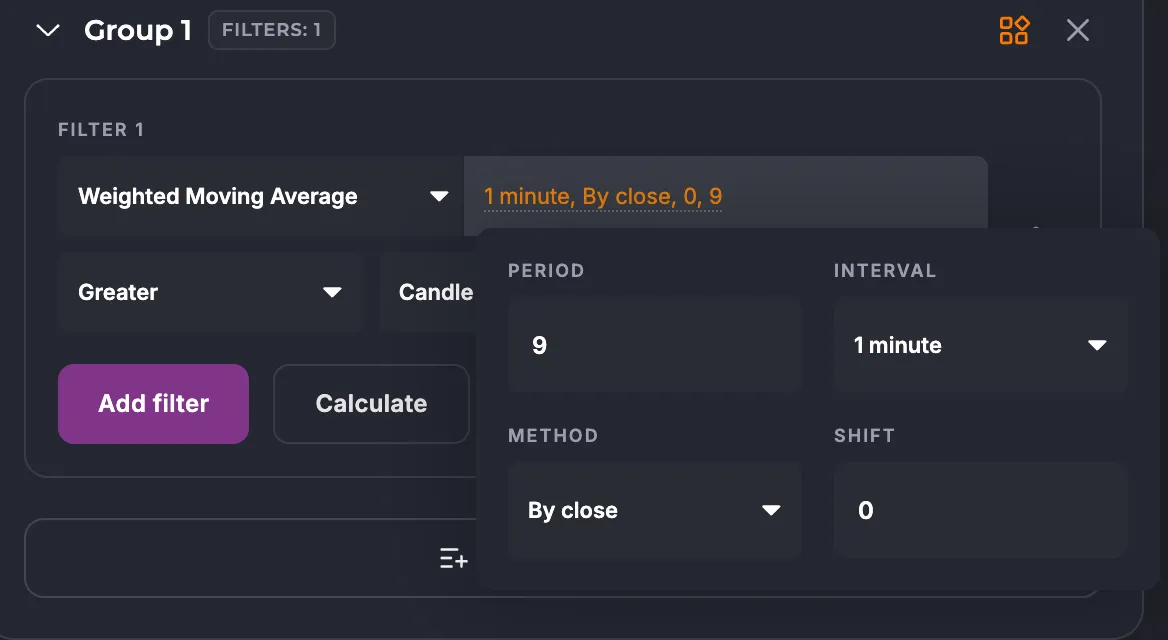
Section titled “Use in Veles Bots (Flexible Indicators)”Available settings:
- Period — number of candles for calculation. Range: 2–500, default value: 9.
- Interval — candle timeframe.
- Method — calculation type. By bar close (on the selected interval only), or by minute (once per minute for any interval).
- Shift — shifts the requested indicator value back by the specified number of candles.
Limitations
Section titled “Limitations”- WMA is a trend indicator: it shows the general direction of price movement, not reversal points.
- Due to linear weighting, WMA is more sensitive to sharp price spikes than SMMA — a single anomalous candle with a high weight can noticeably shift the line.
- For better accuracy, it is recommended to use WMA in combination with other indicators (RSI, ATR, MACD) and support/resistance levels.
- In Veles bots, WMA can be used as an entry or exit filter, combined with any other conditions.
Summary
Section titled “Summary”WMA is a trend filter with linear weights that responds to price changes faster than SMA and SMMA. In Veles bots, it enables strategies focused on current price action with reduced lag. Most effective on trending markets in combination with momentum indicators such as RSI or MACD.