Ichimoku Cloud
Ichimoku Cloud is a technical indicator that helps identify trend direction as well as potential support and resistance zones in the market.
How Ichimoku Cloud Works
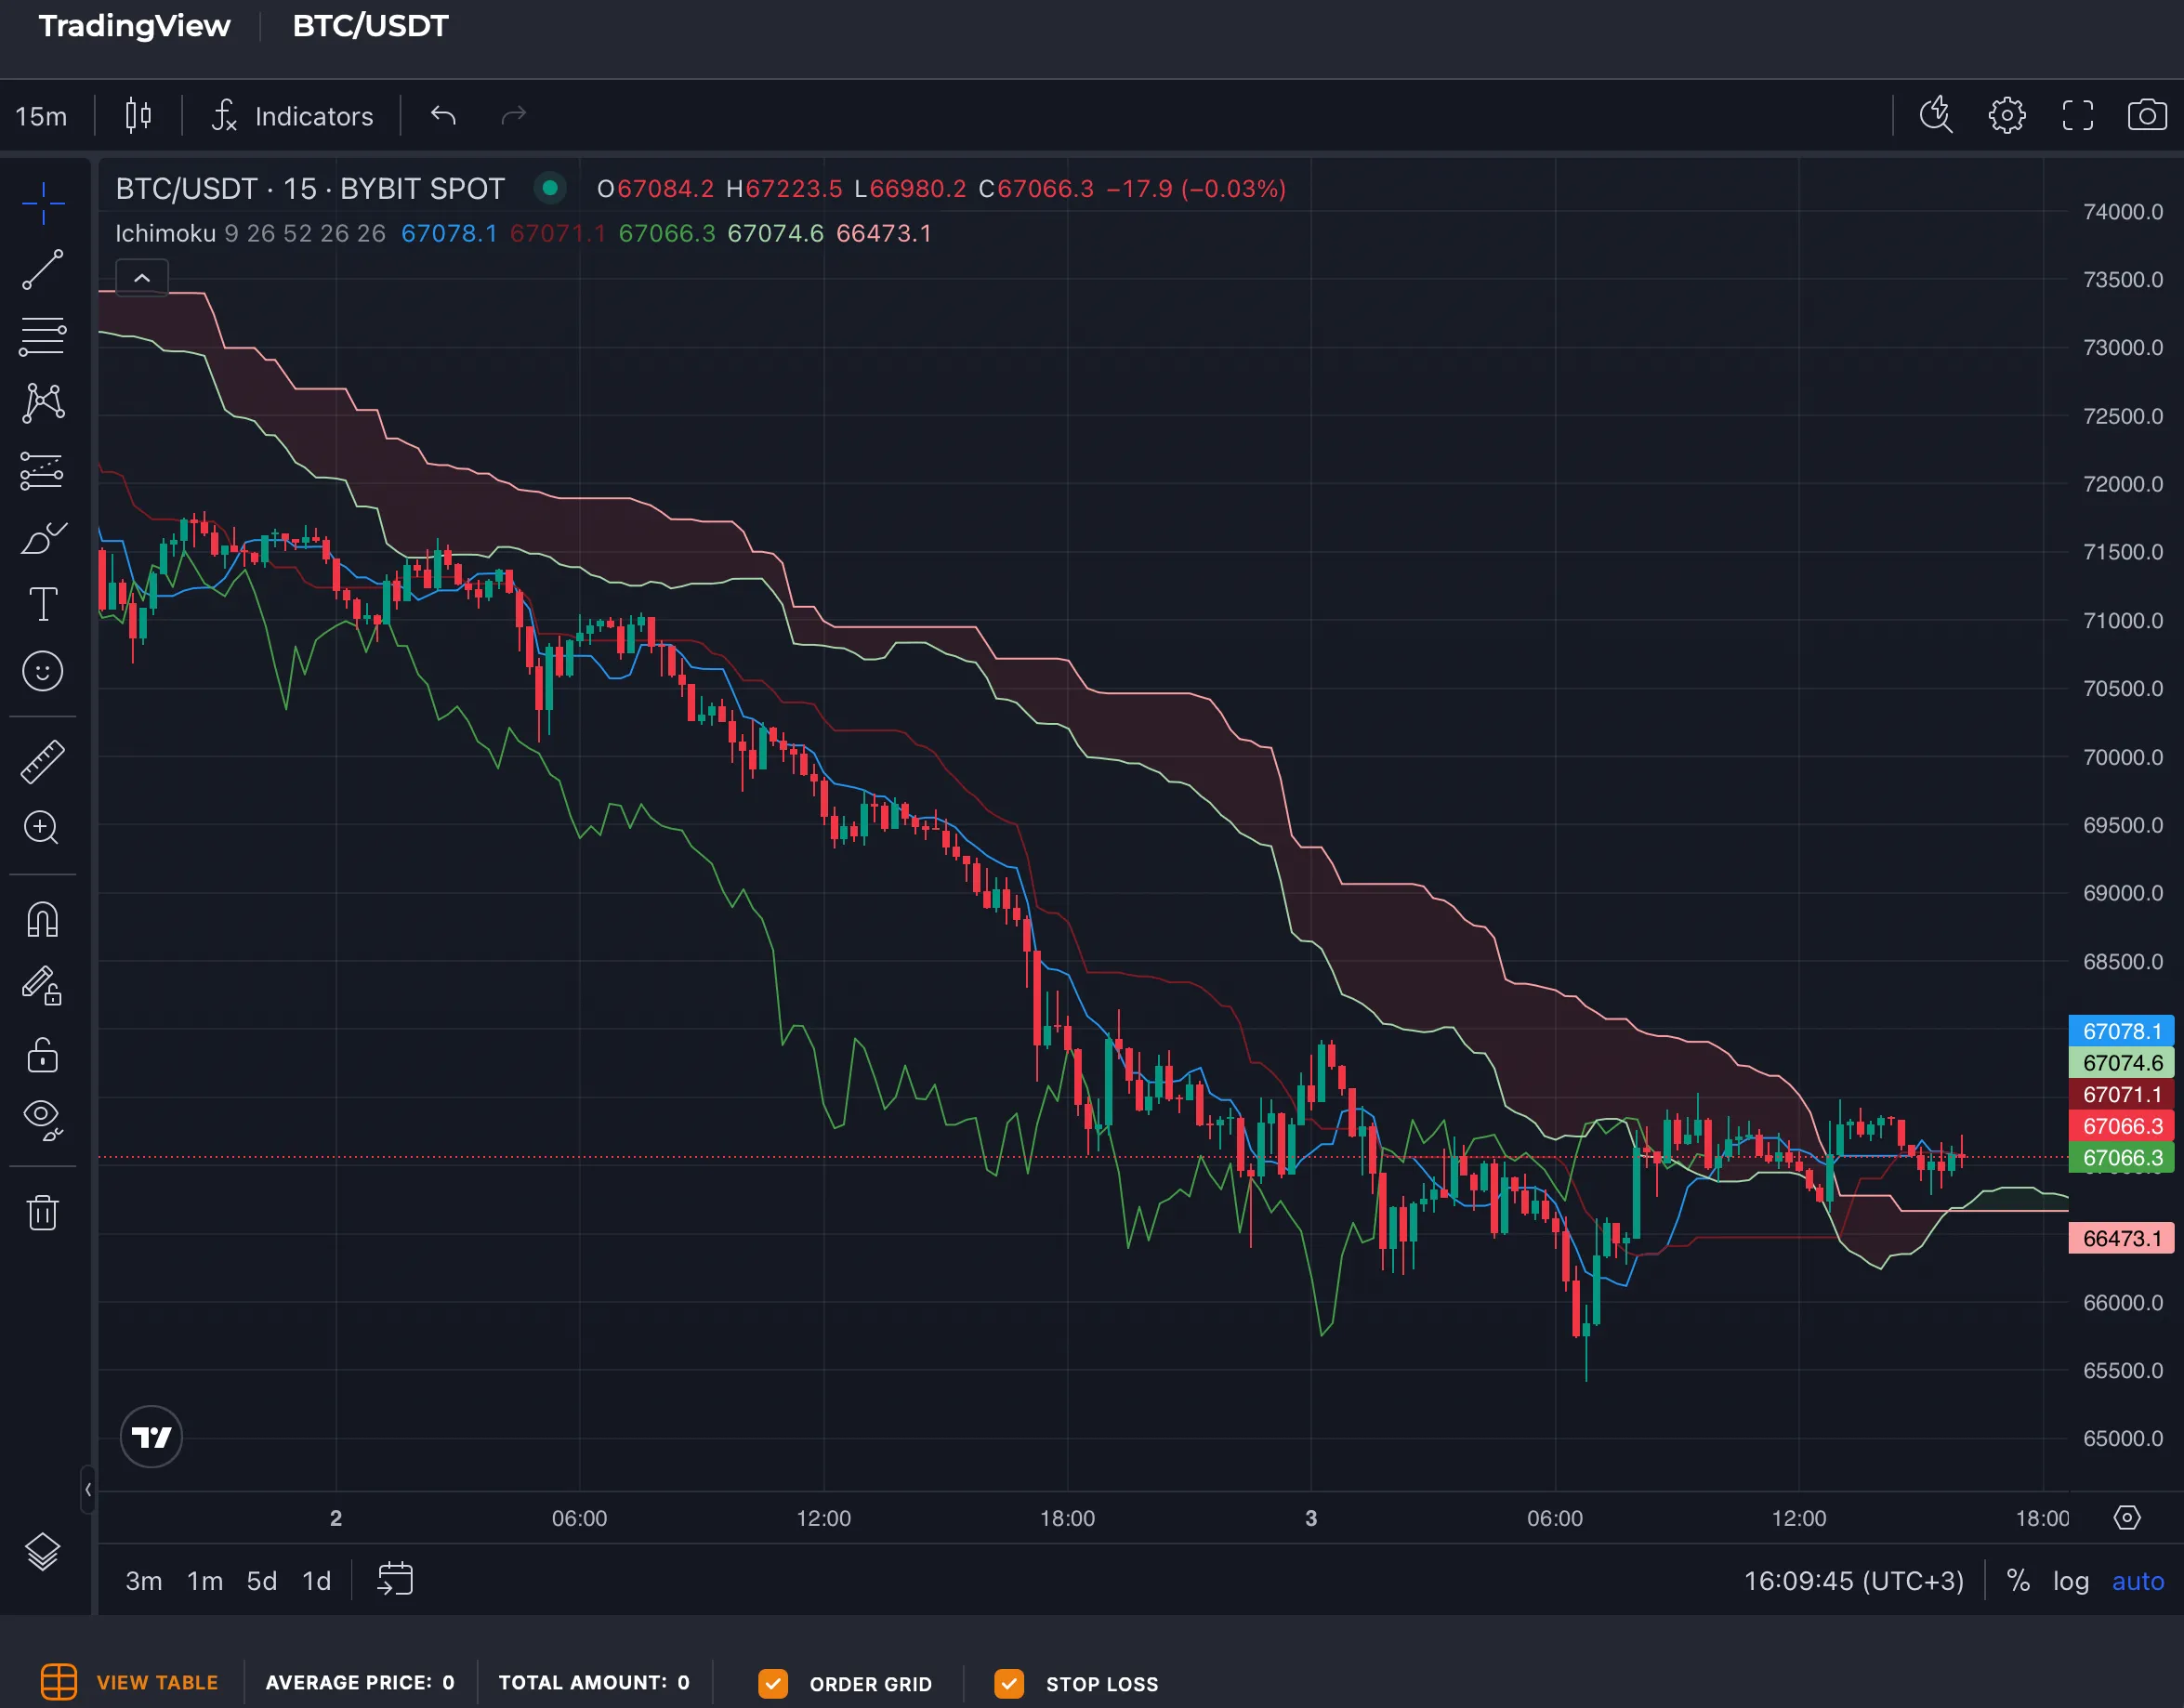
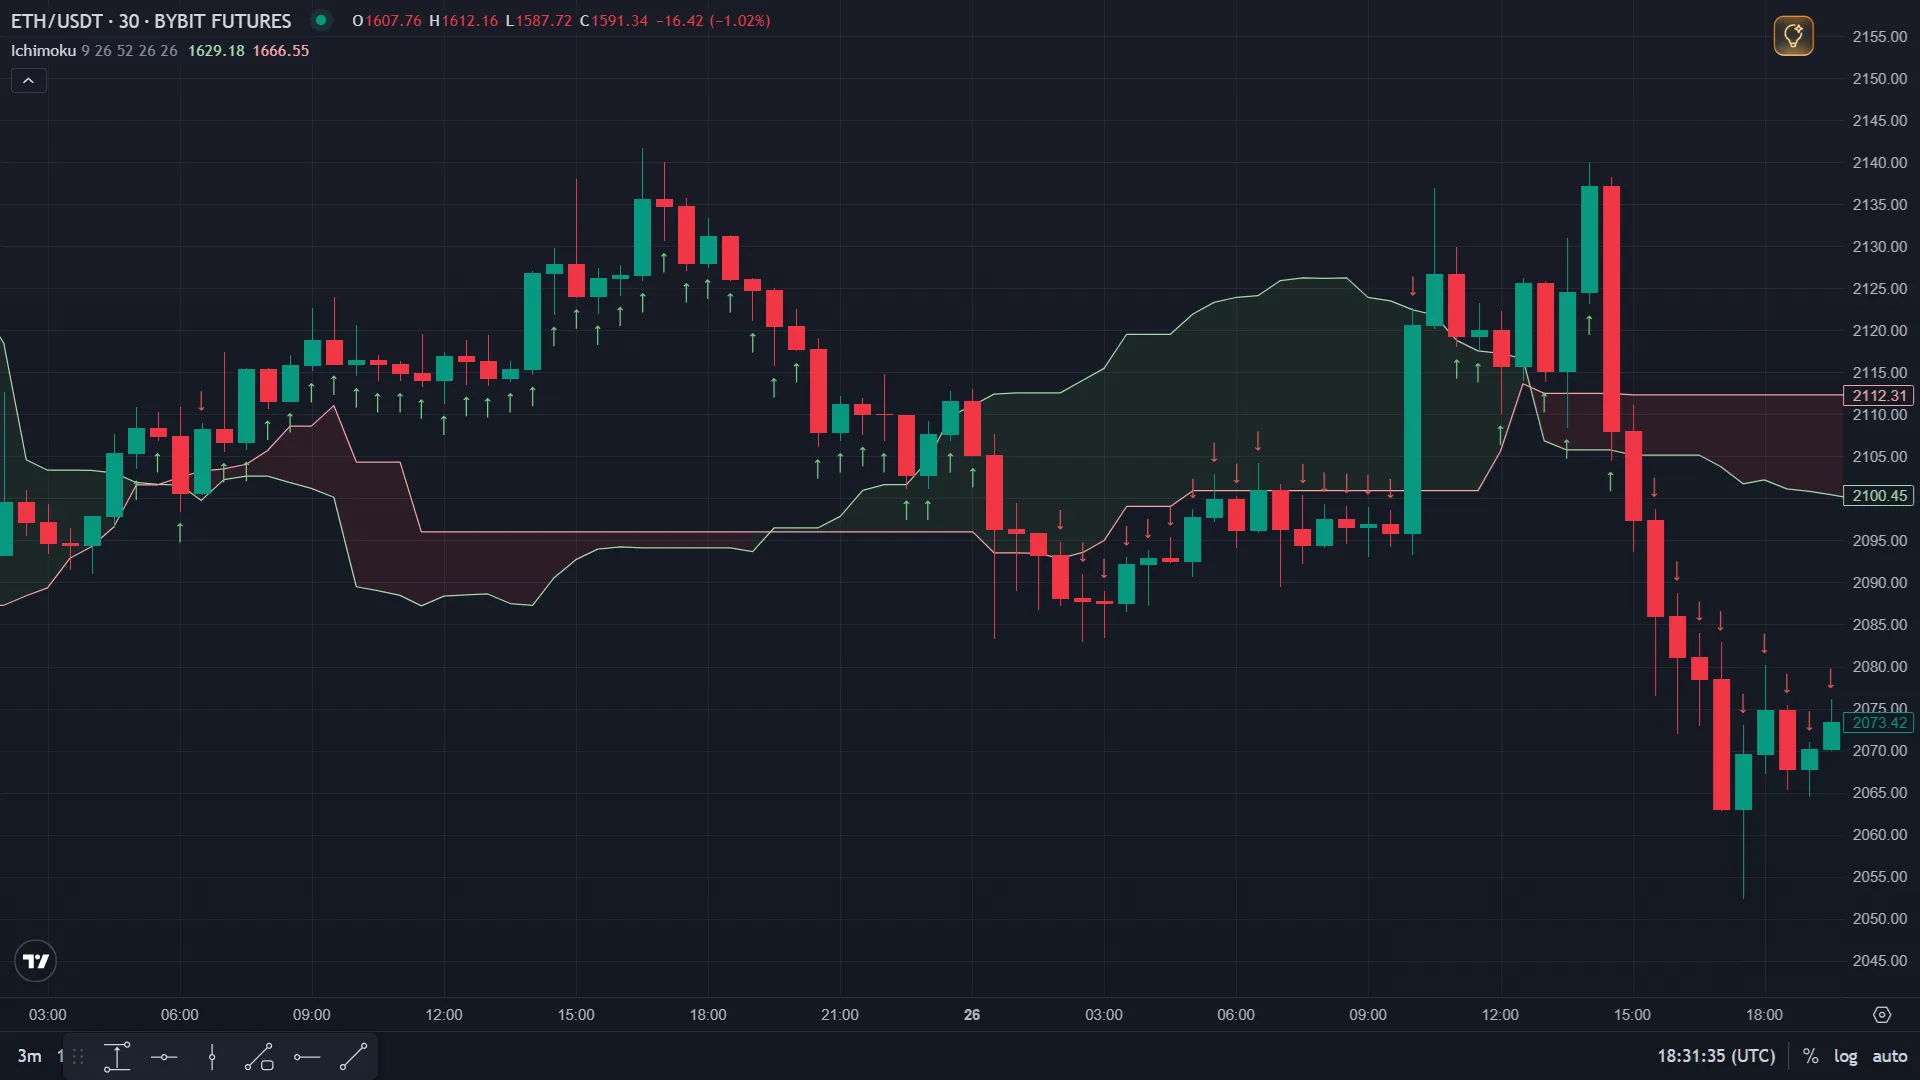
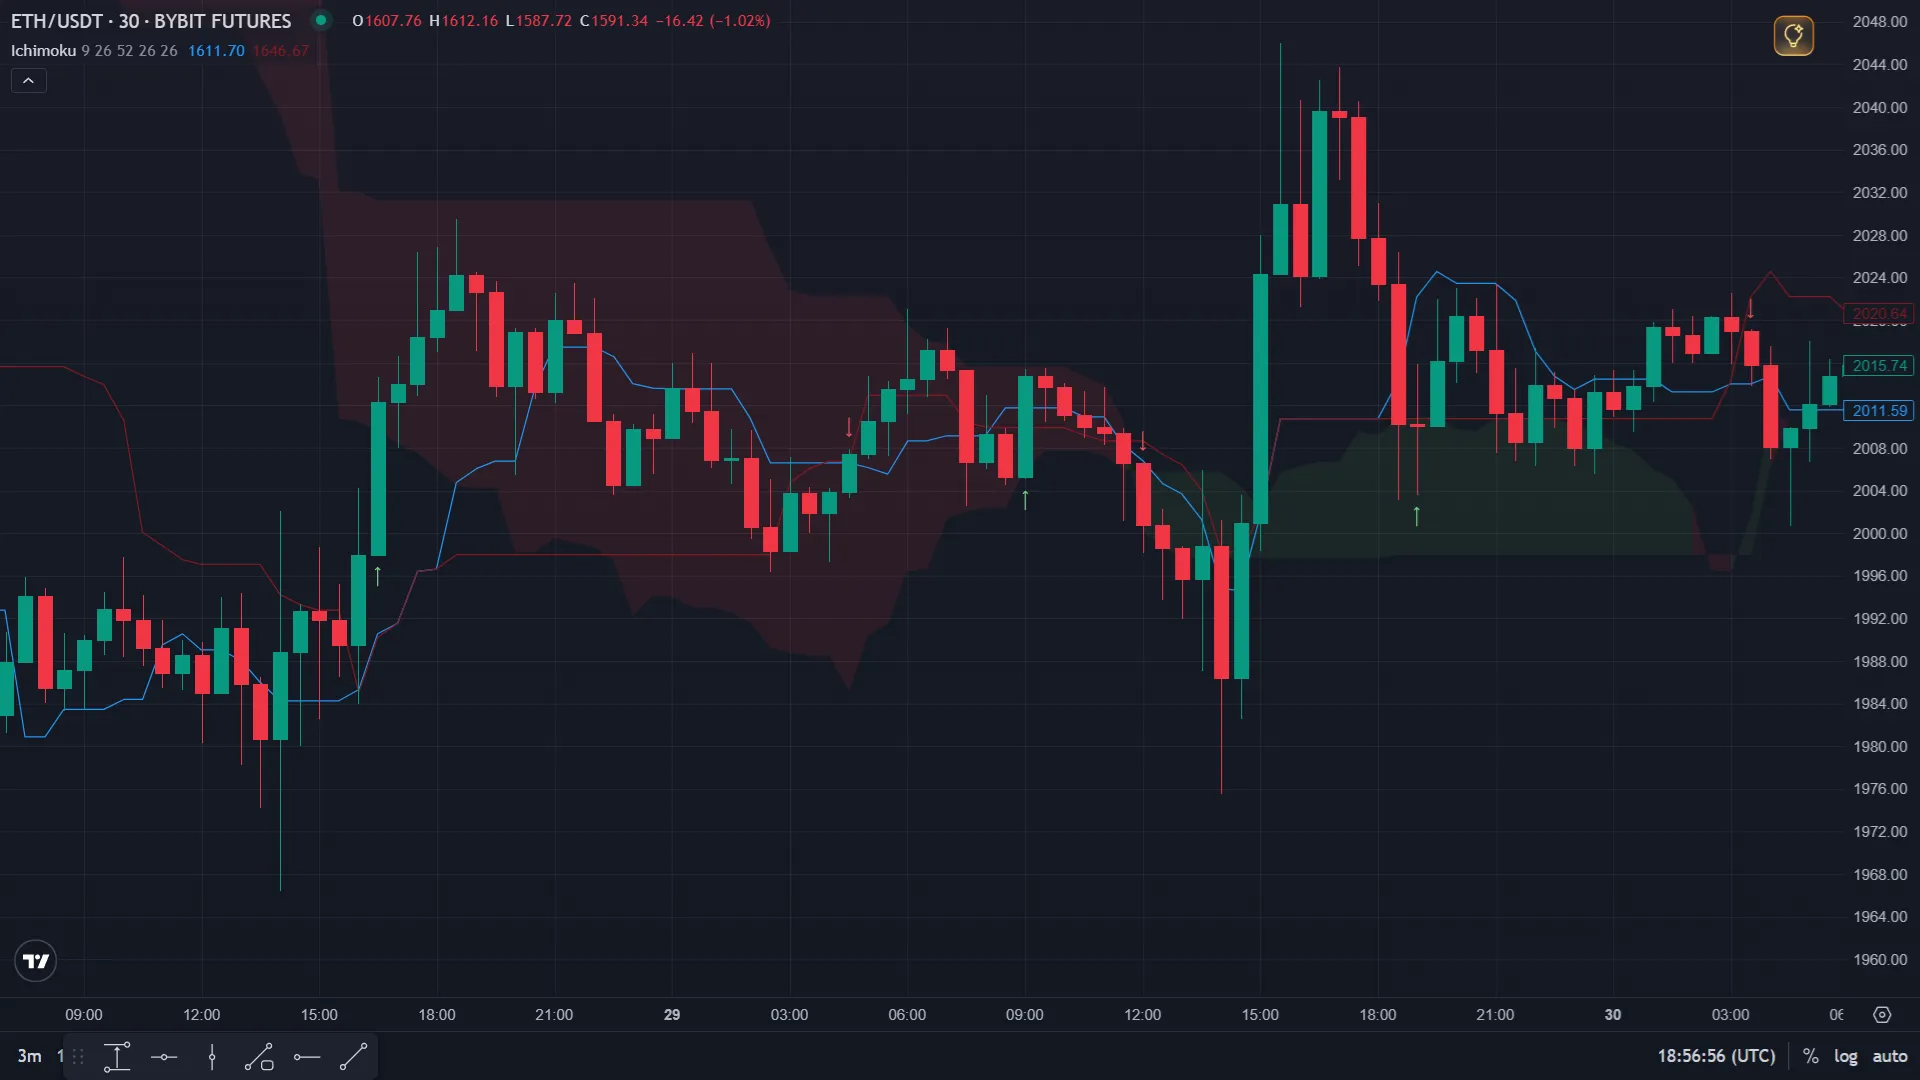
Section titled “How Ichimoku Cloud Works”The key feature of the indicator is the Kumo cloud, which is built between two lines: Senkou Span A and Senkou Span B. The cloud is shifted 26 periods forward, showing potential support and resistance zones. Its color depends on the relative position of the lines: green when line A is above line B, and red when line B is above line A.
The indicator includes the following components:
- Tenkan-sen (Conversion Line) — the average price over the last 9 periods. A fast signal line that reflects short-term momentum.
- Kijun-sen (Base Line) — the average price over the last 26 periods. A slower line that shows the medium-term trend.
- Senkou Span A — the average of Tenkan-sen and Kijun-sen, shifted 26 periods forward. Forms one boundary of the cloud.
- Senkou Span B — the average price over the last 52 periods, shifted 26 periods forward. Forms the second boundary of the cloud.
- Chikou Span (Lagging Line) — the current closing price shifted 26 periods backward. It is usually used for additional trend confirmation and not as a standalone signal.
Senkou Span A formula:
Span A = (Tenkan-sen + Kijun-sen) / 2, shift +26 periods
Senkou Span B formula:
Span B = (MAX High over 52 periods + MIN Low over 52 periods) / 2, shift +26 periods
Limitations
Section titled “Limitations”- The indicator works best in trending markets; in sideways market conditions, false signals are possible.
- In volatile markets or during sharp price movements, signals may arrive with a delay.
- For more reliable signals, it is recommended to use timeframes of 1 hour and above.
Usage in Veles Bots
Section titled “Usage in Veles Bots”The platform provides three signal types for this indicator: “Kumo Breakout”, “Color Change”, and “Tenkan and Kijun Cross”.
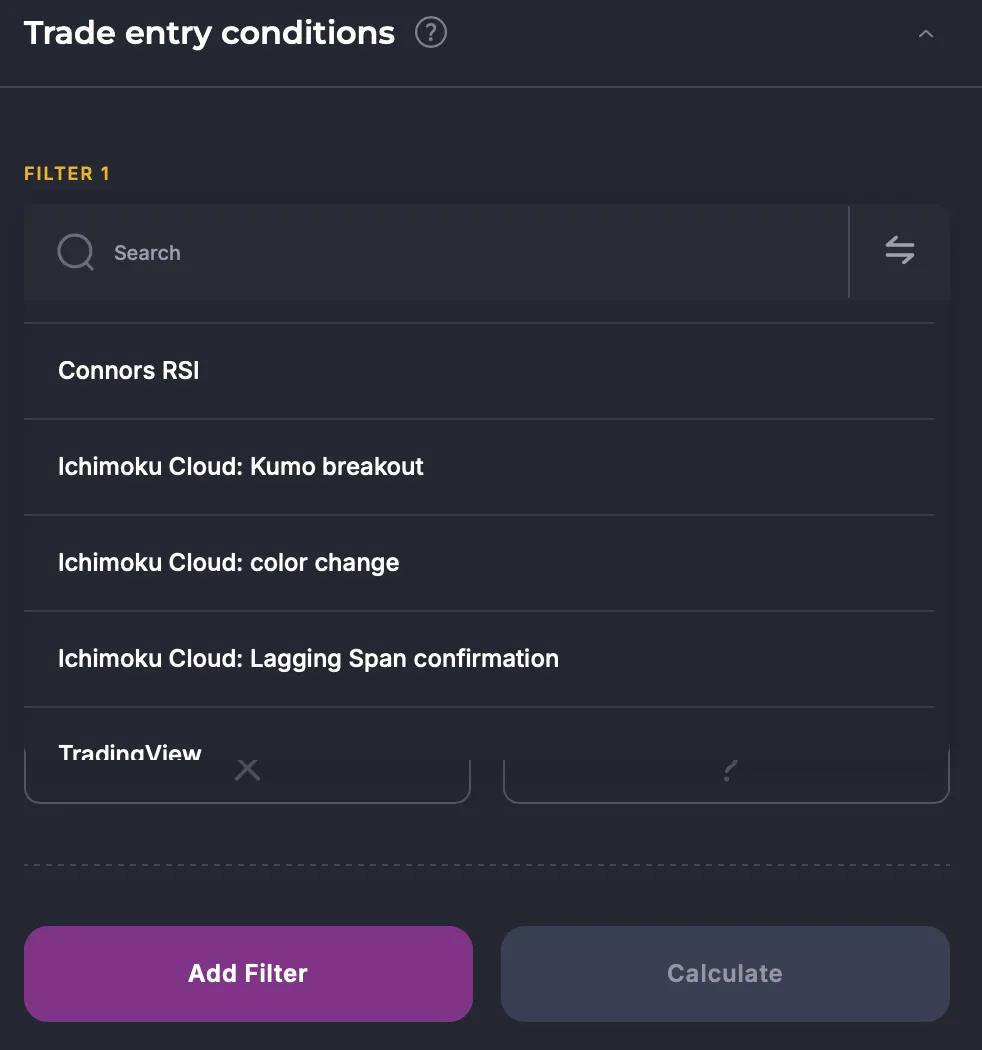
Ichimoku Cloud: Kumo Breakout
Section titled “Ichimoku Cloud: Kumo Breakout”Used to determine the direction of the current trend.
- Buy (long) signal or closing a short position: appears when the candle closes above the cloud.
- Sell (short) signal or closing a long position: appears when the candle closes below the cloud.
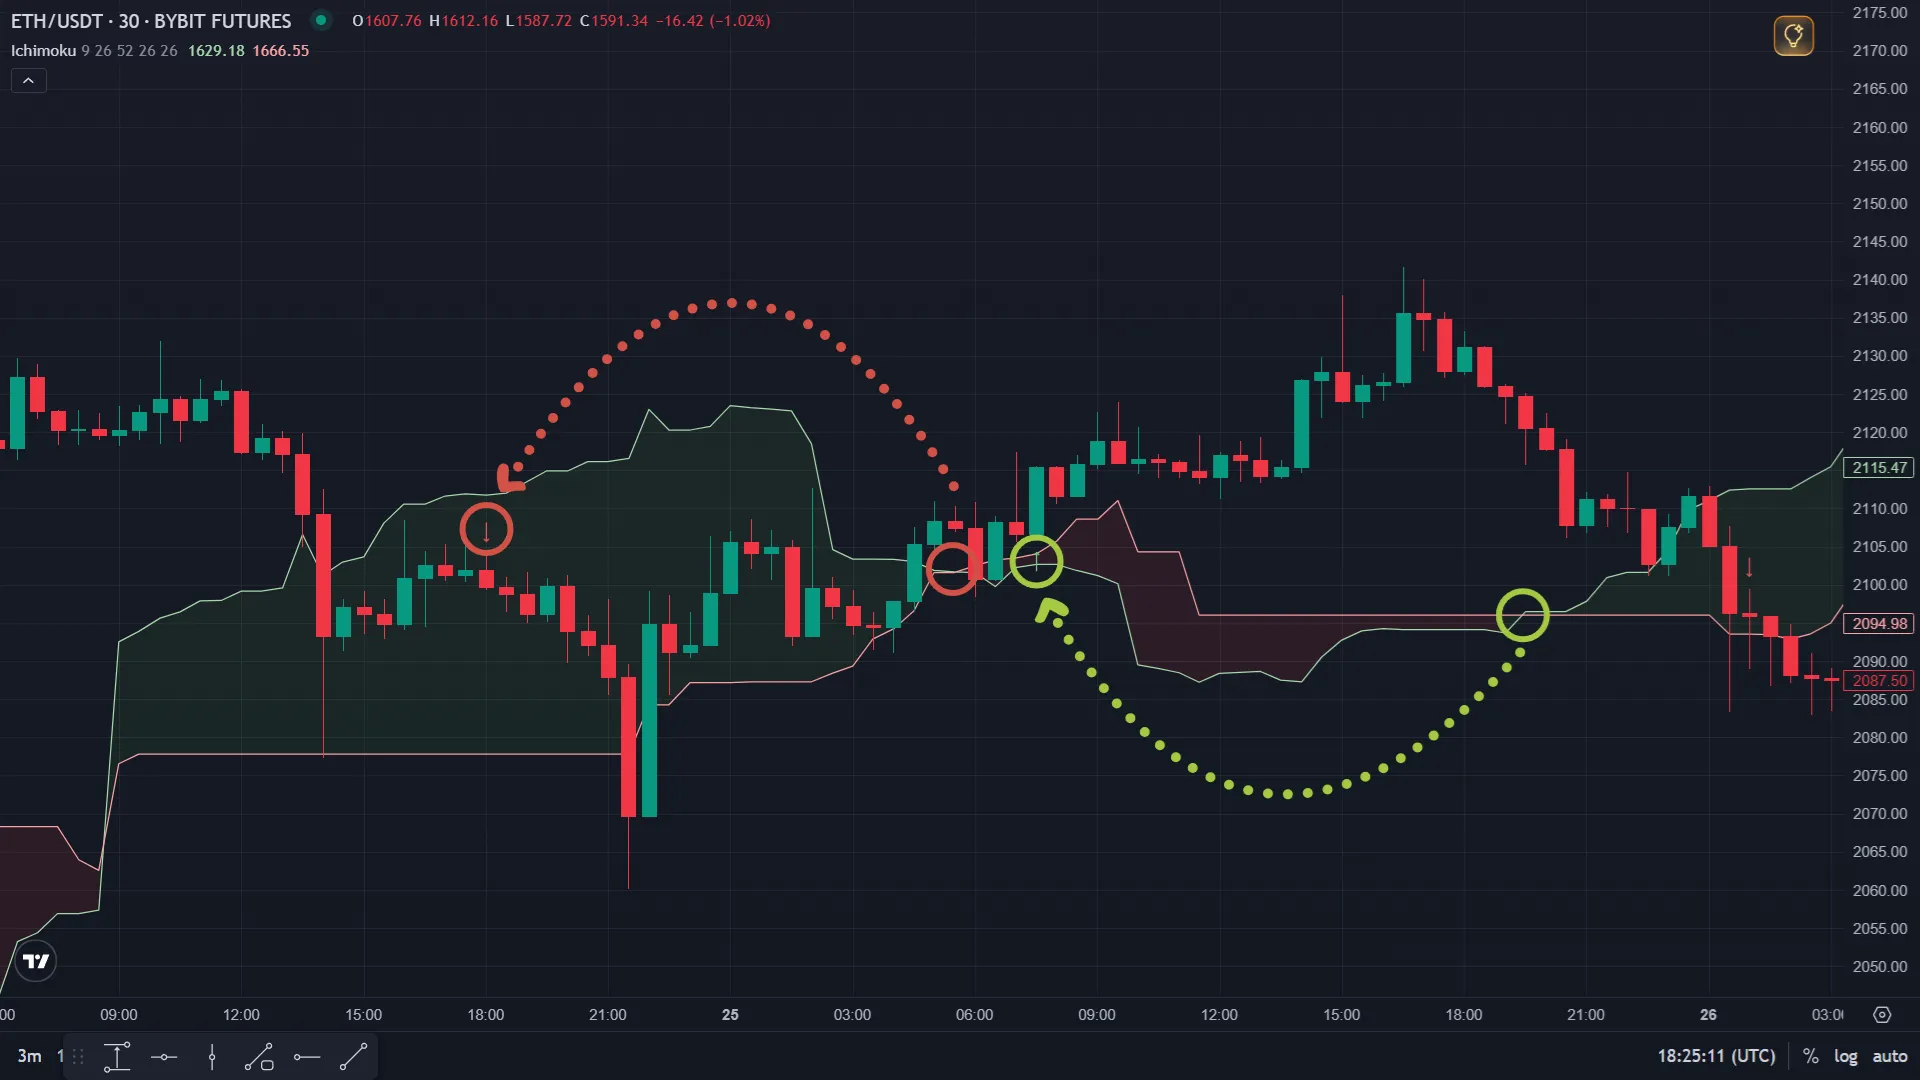
Ichimoku Cloud: Color Change
Section titled “Ichimoku Cloud: Color Change”This is a leading signal that indicates a possible upcoming trend reversal.
- Buy (long) signal or closing a short position: Senkou Span A crosses Senkou Span B from bottom to top, and the cloud changes from red to green.
- Sell (short) signal or closing a long position: Senkou Span A crosses Senkou Span B from top to bottom, and the cloud changes from green to red.
Ichimoku Cloud: Tenkan and Kijun Cross
Section titled “Ichimoku Cloud: Tenkan and Kijun Cross”The crossing of these lines is used as an indicator of price momentum direction.
- Buy (long) signal or closing a short position: appears when Tenkan-sen crosses Kijun-sen from bottom to top (a “golden cross”).
- Sell (short) signal or closing a long position: appears when Tenkan-sen crosses Kijun-sen from top to bottom (a “death cross”).
Summary
Section titled “Summary”Use Ichimoku Cloud: Kumo Breakout when:
- You need a clear signal when a key support or resistance level is broken.
- You need to determine the direction of the current trend.
Use Ichimoku Cloud: Color Change when:
- It is important to track a trend reversal at an early stage.
- It fits medium-term strategies.
Use Ichimoku Cloud: Tenkan and Kijun Cross when:
- You want to enter and exit a trade when momentum changes direction.
Final recommendation: combine all three signal types or supplement them with flexible components (Span A, Span B, Lagging Span, Tenkan-sen, Kijun-sen) to build multi-layered strategies with more accurate signal filtering.
Check the indicator using backtests before launching a bot.
Ichimoku Cloud and Flexible Indicators
Section titled “Ichimoku Cloud and Flexible Indicators”In addition to the ready-made signal options, four Ichimoku Cloud components are available on the platform as standalone indicators for flexible algorithm configuration.
Senkou Span A
Section titled “Senkou Span A”Senkou Span A is the fast cloud boundary, calculated as the average of the Tenkan-sen and Kijun-sen lines, shifted forward by the specified number of periods.
- Usage: defines dynamic support in an uptrend or resistance in a downtrend.
- Example: when the price crosses the Span A level, it may signal a short-term direction change. It can be used as a trigger for entering or exiting a position.
Senkou Span B
Section titled “Senkou Span B”Senkou Span B is the slow cloud boundary, calculated as the average of the maximum and minimum prices over a specified period, shifted forward by a certain number of candles.
- Usage: a stronger support or resistance level compared with Span A. A wide cloud between Span A and Span B indicates a strong trend.
- Example: when the price stays above or below Span B, it confirms trend continuation; a breakout of Span B may signal the end of the trend.
Tenkan-sen (Conversion Line)
Section titled “Tenkan-sen (Conversion Line)”Tenkan-sen (Conversion Line) is a fast signal line that reflects the short-term trend.
Kijun-sen (Base Line)
Section titled “Kijun-sen (Base Line)”Kijun-sen (Base Line) is the average price over a specified number of periods. It is a slower line that shows the medium-term trend.
- Usage: Tenkan and Kijun can be used as trend lines, and their cross can be used as a signal of momentum direction change.
- Example: if the price closes above the lines, it signals a stable trend. Their crossings may indicate a change in market sentiment.
Using in Veles Bots (Flexible Indicators)
Section titled “Using in Veles Bots (Flexible Indicators)”Available settings:
- Period - the length of the indicator line. Range: 5–100. Default depends on the component: Conversion Line — 9, Base Line — 26, Leading Span B — 52, Lagging Span — 26. Not applicable to signal types (Kumo Breakout, Color Change, TK Cross).
- Interval - the candle timeframe.
- Method - the calculation type. By bar close (only on the selected interval) or by minute (once per minute for any interval).
- Shift - shifts the requested indicator value back by the specified number of candles.
- Direction - “Buy” or “Sell”. Here you can determine direct or reverse logic for the filter (signals only).