Candle
Candle is an indicator that provides access to individual candlestick data: open price, close price, high, low, and trading volume. It is used in flexible strategy conditions to compare price parameters against other indicators.
How It Works
Section titled “How It Works”- The bot retrieves the candlestick history for the selected trading pair.
- Based on the Shift setting, it selects the target candle (0 = current, 1 = previous, etc.).
- The value of the specified data source (Open, Close, High, Low, or Volume) is extracted from that candle.
- The extracted value is used in the condition logic — compared against another indicator or a constant.
- Calculation is performed according to the selected method: on candle close or every minute.
Available Data Sources
Section titled “Available Data Sources”| Source | Description |
|---|---|
| Open | Candle opening price |
| Close | Candle closing price |
| High | Highest price within the candle period |
| Low | Lowest price within the candle period |
| Volume | Trading volume within the candle period |
Configurable Parameters
Section titled “Configurable Parameters”- Interval — the candle timeframe (e.g., 1m, 5m, 1h, 1d). Determines which period’s data is used.
- Shift — offset relative to the current candle.
0= current candle,1= previous closed candle,2= the one before that, etc. - Calculation Method:
- On candle close — the value updates only after each candle closes.
- Every minute — the value recalculates every minute using live data from the current open candle.
Usage Examples
Section titled “Usage Examples”Comparison operators: “greater/less than” vs “crosses up/down”
Section titled “Comparison operators: “greater/less than” vs “crosses up/down””Before diving into examples, it is important to understand the difference between operators — this directly affects how the strategy behaves.
| Operator | Behavior | When to use |
|---|---|---|
| > (greater than) | Signal fires on every candle while Candle Close stays above SMA | Holding a position, trend filters |
| < (less than) | Signal fires on every candle while Candle Close stays below SMA | Holding a position, trend filters |
| ↑ Crosses up | Signal fires once — at the moment Candle Close crosses SMA from below | Entering a position on breakout |
| ↓ Crosses down | Signal fires once — at the moment Candle Close crosses SMA from above | Exiting a position on breakout |
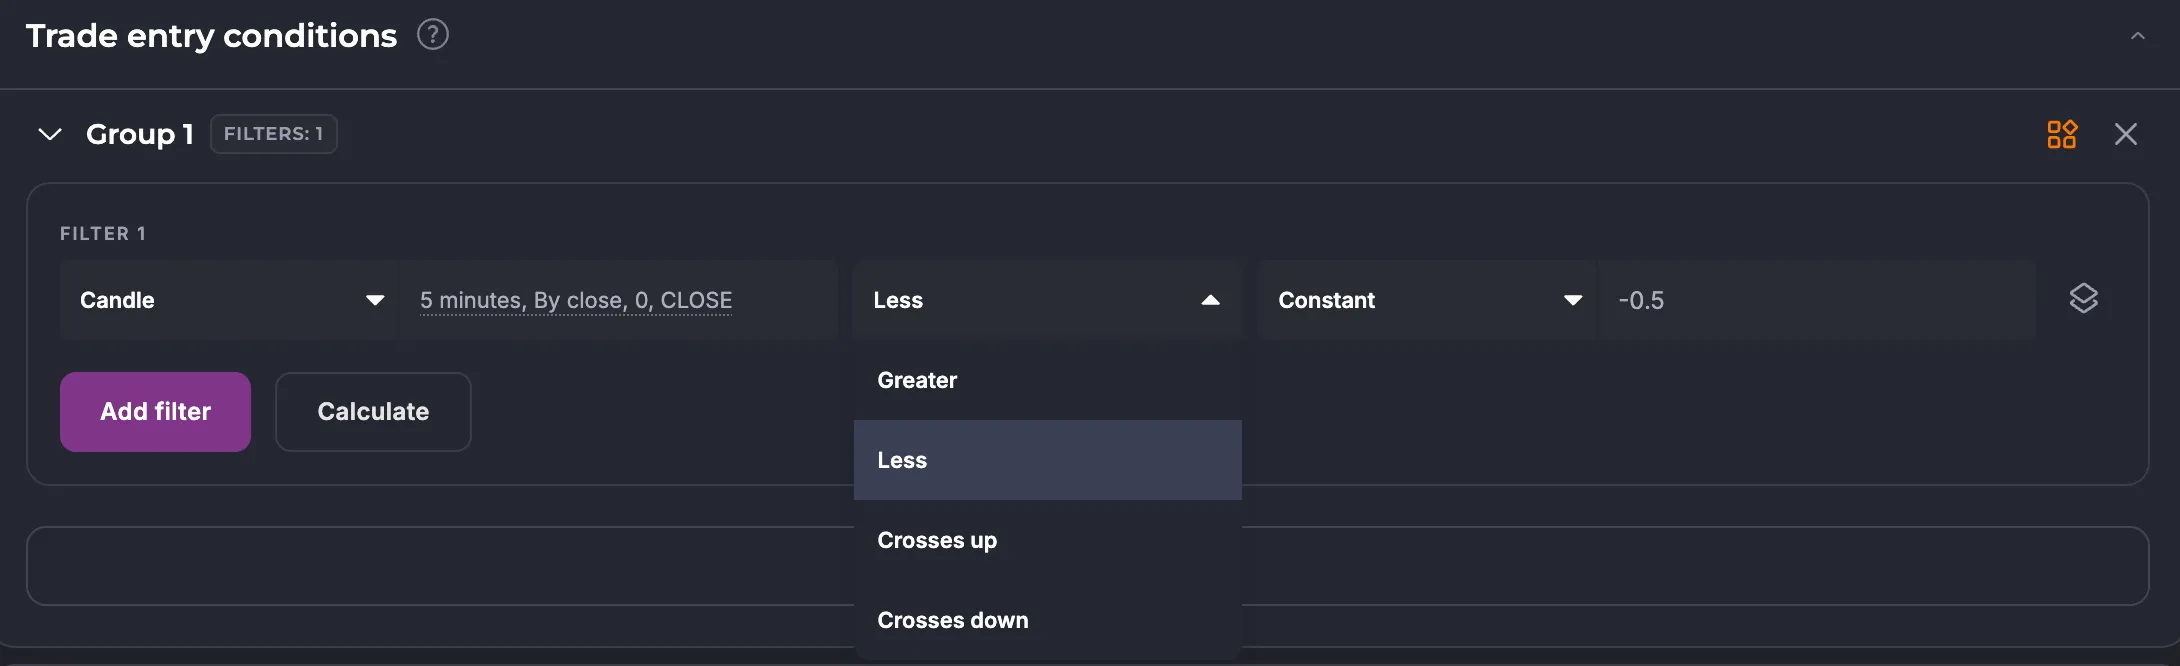
All four options are configured in the condition editor when selecting the operator between two indicators.
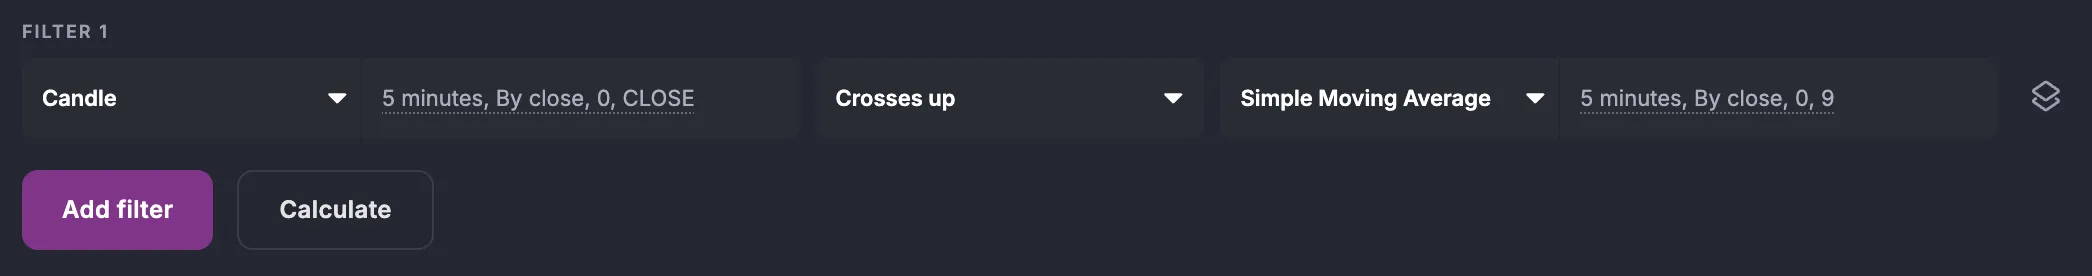
Candle Close and SMA — price crossing a moving average
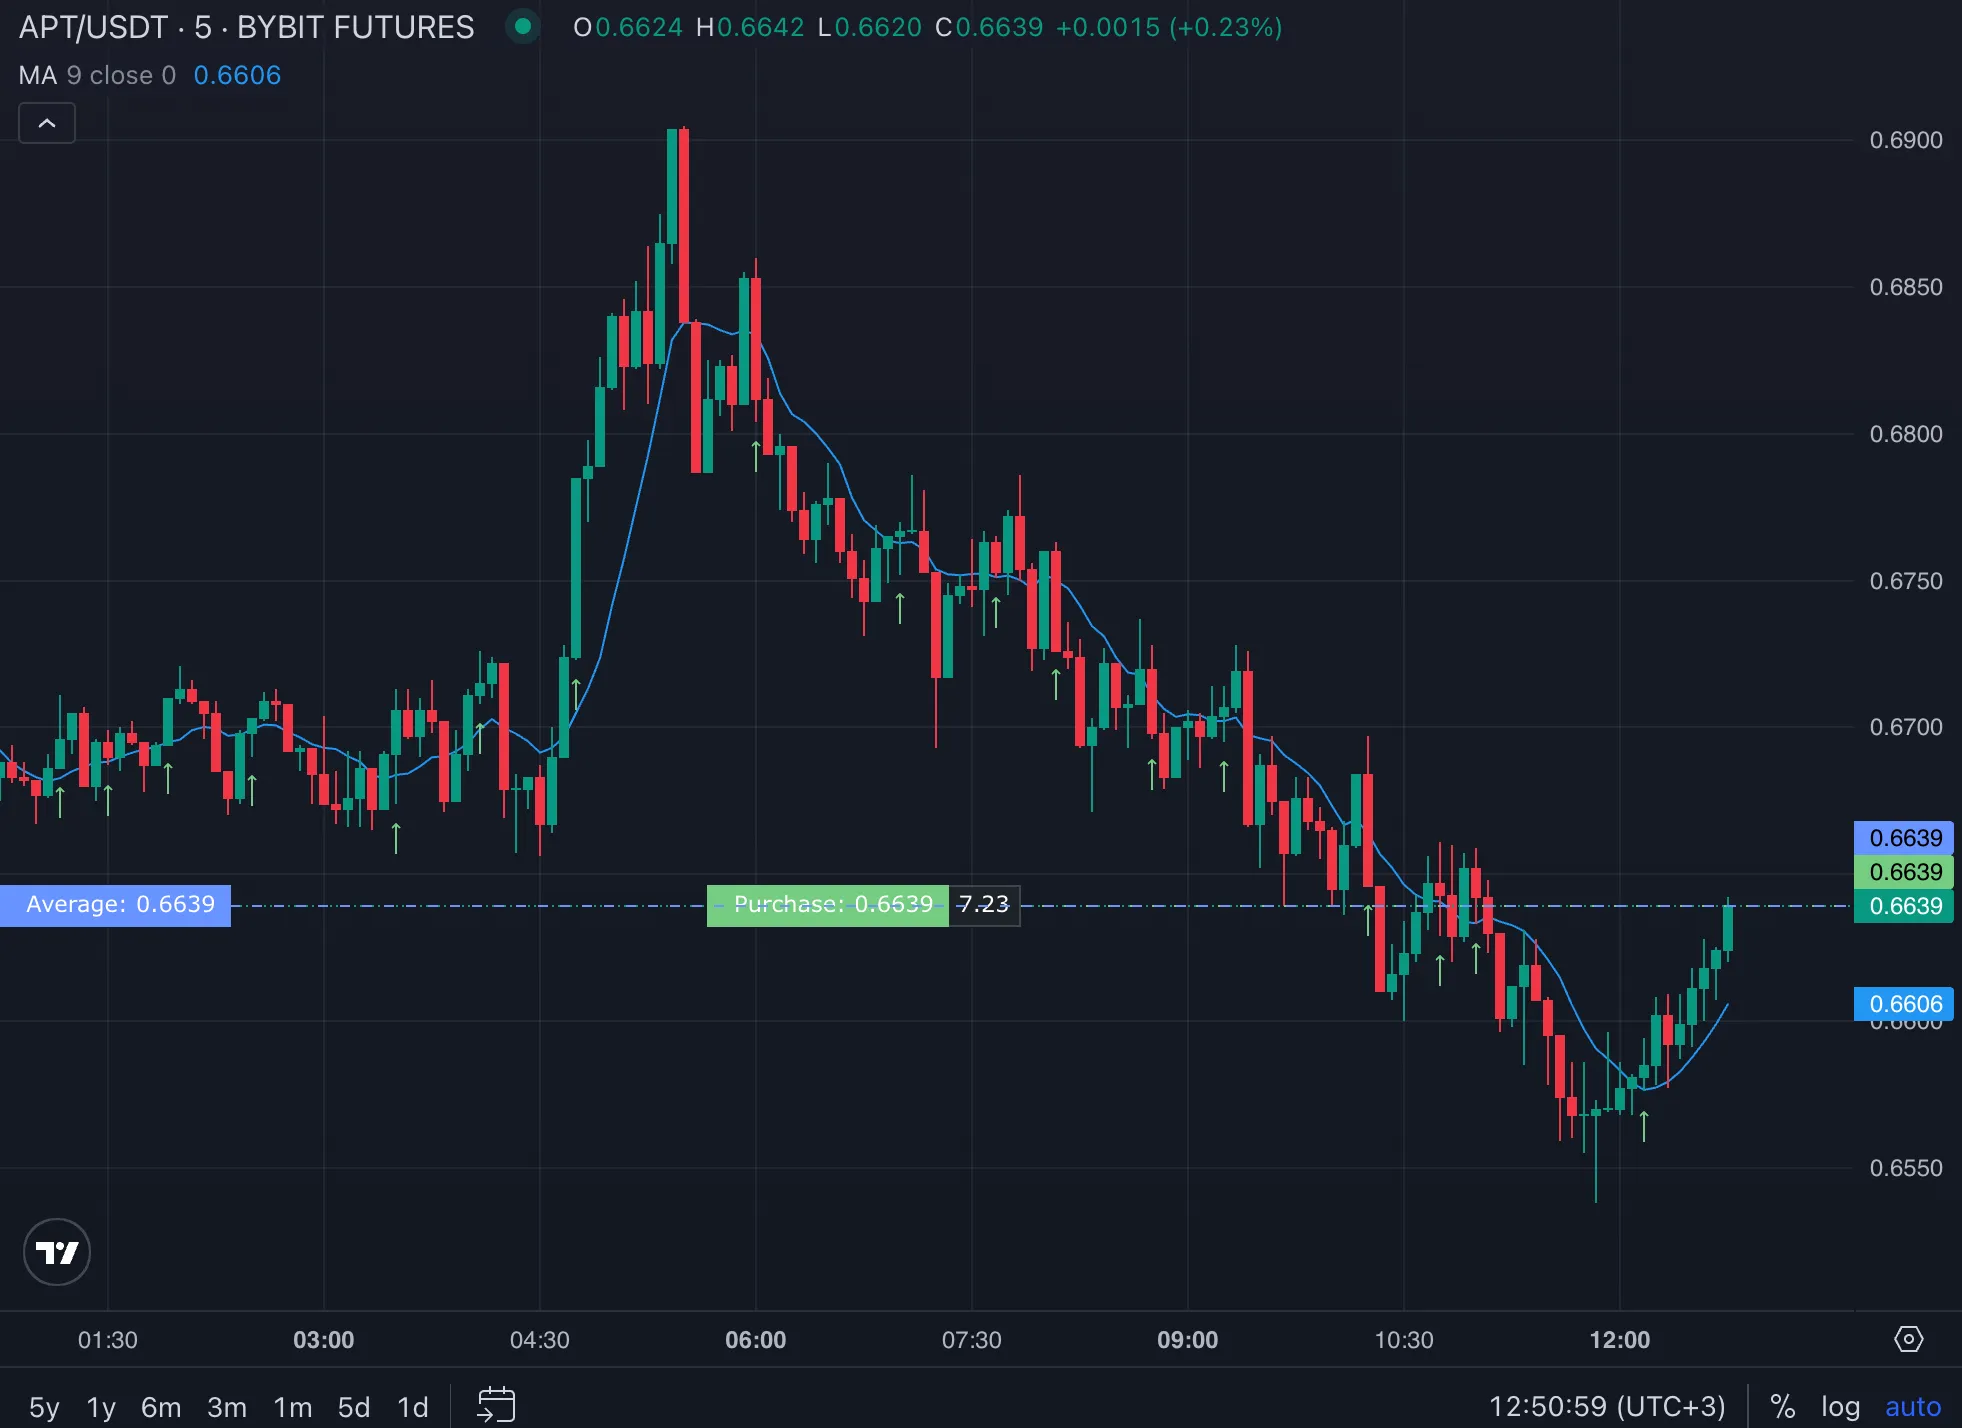
Section titled “Candle Close and SMA — price crossing a moving average”A classic signal: enter a long position at the moment the closing price crosses the moving average from below. In the editor it looks like this:
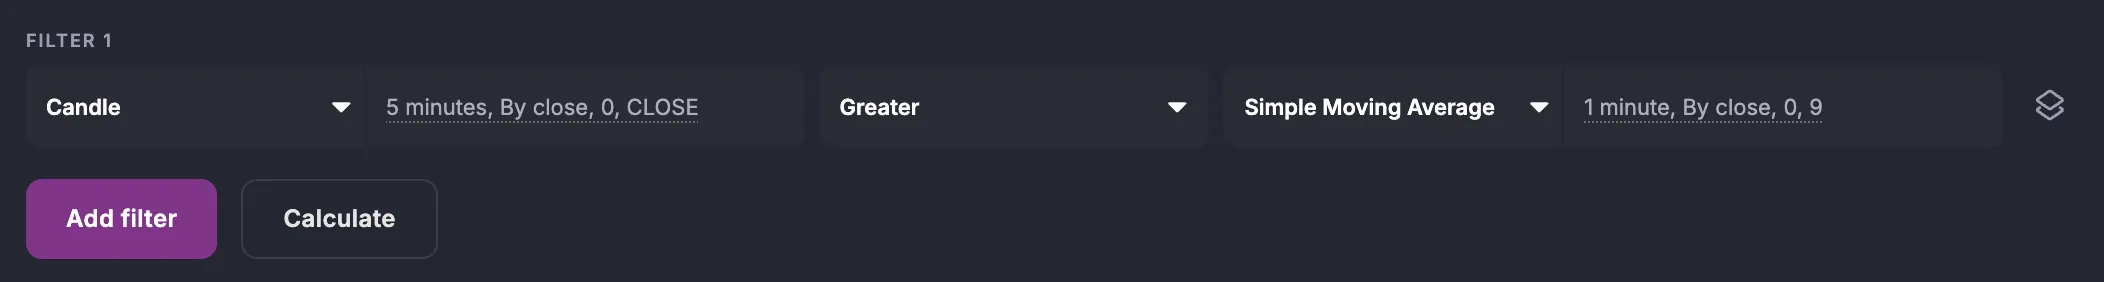
If you need to keep the condition active the entire time price is above SMA (for example, as a trend filter), use the “greater than” operator:
This is the same principle behind all channel indicators: Bollinger Bands, Donchian Channel, and others. Their logic compares the Close of a candle against the upper or lower band:
Candle Close > Bollinger Upper Band → close above the bandCandle Close < Bollinger Lower Band → close below the bandCandle Volume — working with volume data
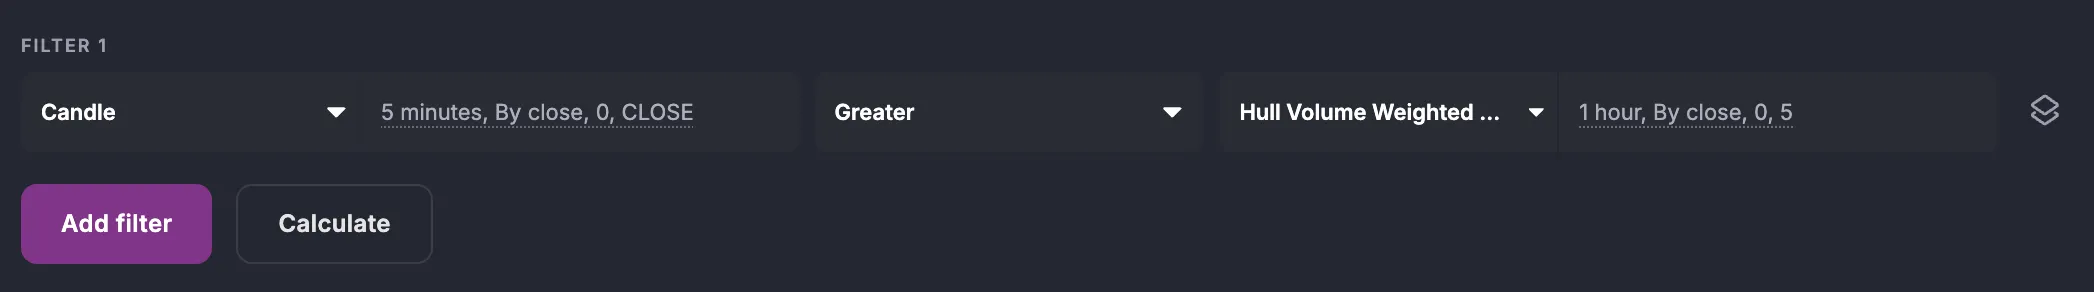
Section titled “Candle Volume — working with volume data”Candle lets you retrieve the volume of a candle and compare it against another value. Two options are available:
1. Compare with Hull Volume Moving Average
The only volume-based moving average available on the platform is Hull Volume Moving Average. If the current volume exceeds its value, this confirms the strength of the move:
2. Compare current volume with volume N candles ago
Using Shift, you can compare the current candle’s volume with the volume of the same timeframe N periods back. For example, current volume is greater than it was 5 candles ago.
Using Shift — comparing data across candles
Section titled “Using Shift — comparing data across candles”Shift is used to access past candle values and compare them with current data or with each other. This lets you build conditions based on multi-candle patterns.
For example, a condition “the previous closed candle was bullish”:
Candle (Close, shift 1) > Candle (Open, shift 1)Or a classic two-candle engulfing pattern:
Candle (Close, shift 1) < Candle (Open, shift 1) [previous candle — bearish]Candle (Close, shift 0) > Candle (Open, shift 0) [current candle — bullish]Impact on Strategy
Section titled “Impact on Strategy”Candle is a universal bridge between market data and condition logic. It lets you build strategies based on real price action rather than derivative indicators alone.
Choosing the right operator (greater/less vs crosses up/down) determines how often conditions fire: “greater than” gives a continuous signal during a trend, while “crosses” gives a one-time signal at the point of breakout.
Summary
Section titled “Summary”Candle is the right tool for these scenarios:
- Price crossing an indicator — use the “crosses up/down” operator to enter/exit on breakout
- Trend filter — use “greater/less than” to keep a condition active throughout a trend
- All channel indicators (Bollinger, Donchian) — work by comparing Candle Close against channel lines
- Volume analysis — compare against Hull Volume Moving Average, or against candle volume N periods ago using Shift
- Multi-candle patterns — analyze historical candle data using the Shift parameter
Start with Candle Close — it is the direct equivalent of the legacy “Price” indicator and is the foundation of most strategies on the platform.