
Marketscan
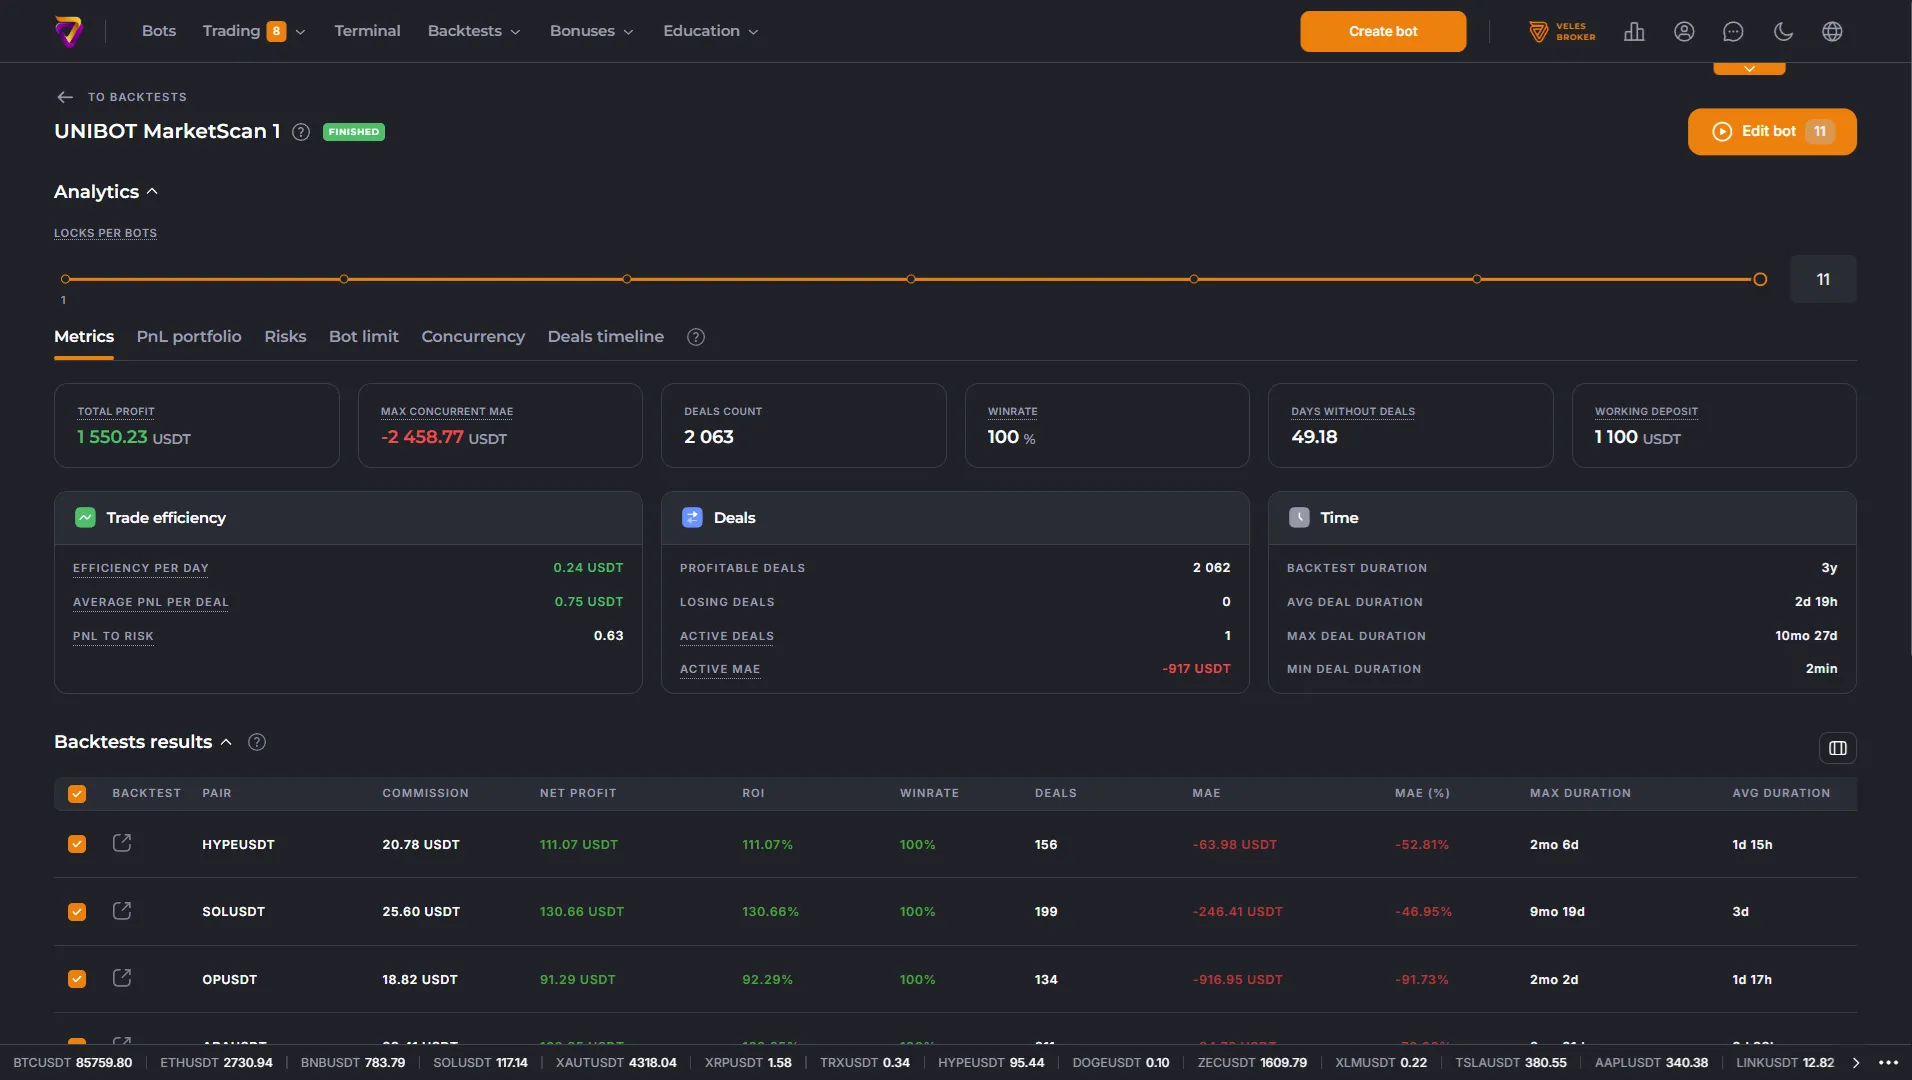
Marketscan is a backtesting tool that allows you to test a single strategy across multiple trading pairs simultaneously and compare the results for each of them.
Why Use Marketscan
Section titled “Why Use Marketscan”Marketscan helps you:
- Find suitable pairs — test a single strategy across dozens of coins and select the ones that yielded the best results with acceptable risk.
- Assess capital requirements — determine the capital needed to trade your chosen number of pairs and the maximum volume of funds committed to the market at any one time.
- Evaluate the impact of limits — compare how the strategy would perform with different limits on simultaneous trades, and see how capital usage and the number of open positions changed.
- Prepare a pair list for a multi-pair bot — select verified pairs using checkboxes and proceed directly to creating the bot from the results.
How it works
Section titled “How it works”-
You create a standard or multi-pair bot with your desired strategy settings.
-
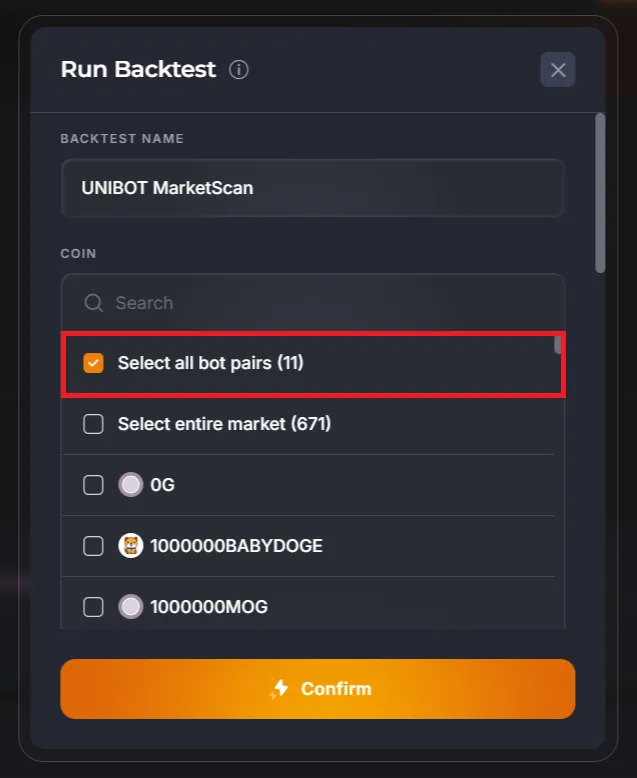
When launching a backtest, you select a list of trading pairs in the dialog box. For a multi-pair bot, you can select all its coins with a single checkbox; for a standard bot, you need to add coins from the list one-by-one.
-
The system runs backtest calculations for each pair, taking into account the selected blocks and constraints.
-
Once complete, you will see a table of results by pair, summary data, and a visualization.
How to read the results
Section titled “How to read the results”All metrics are based on Net Profit — that is, accounting for the exchange’s trading fee. Determine your commission rate so you can specify it correctly when running a backtest.
Single-Pairs Table
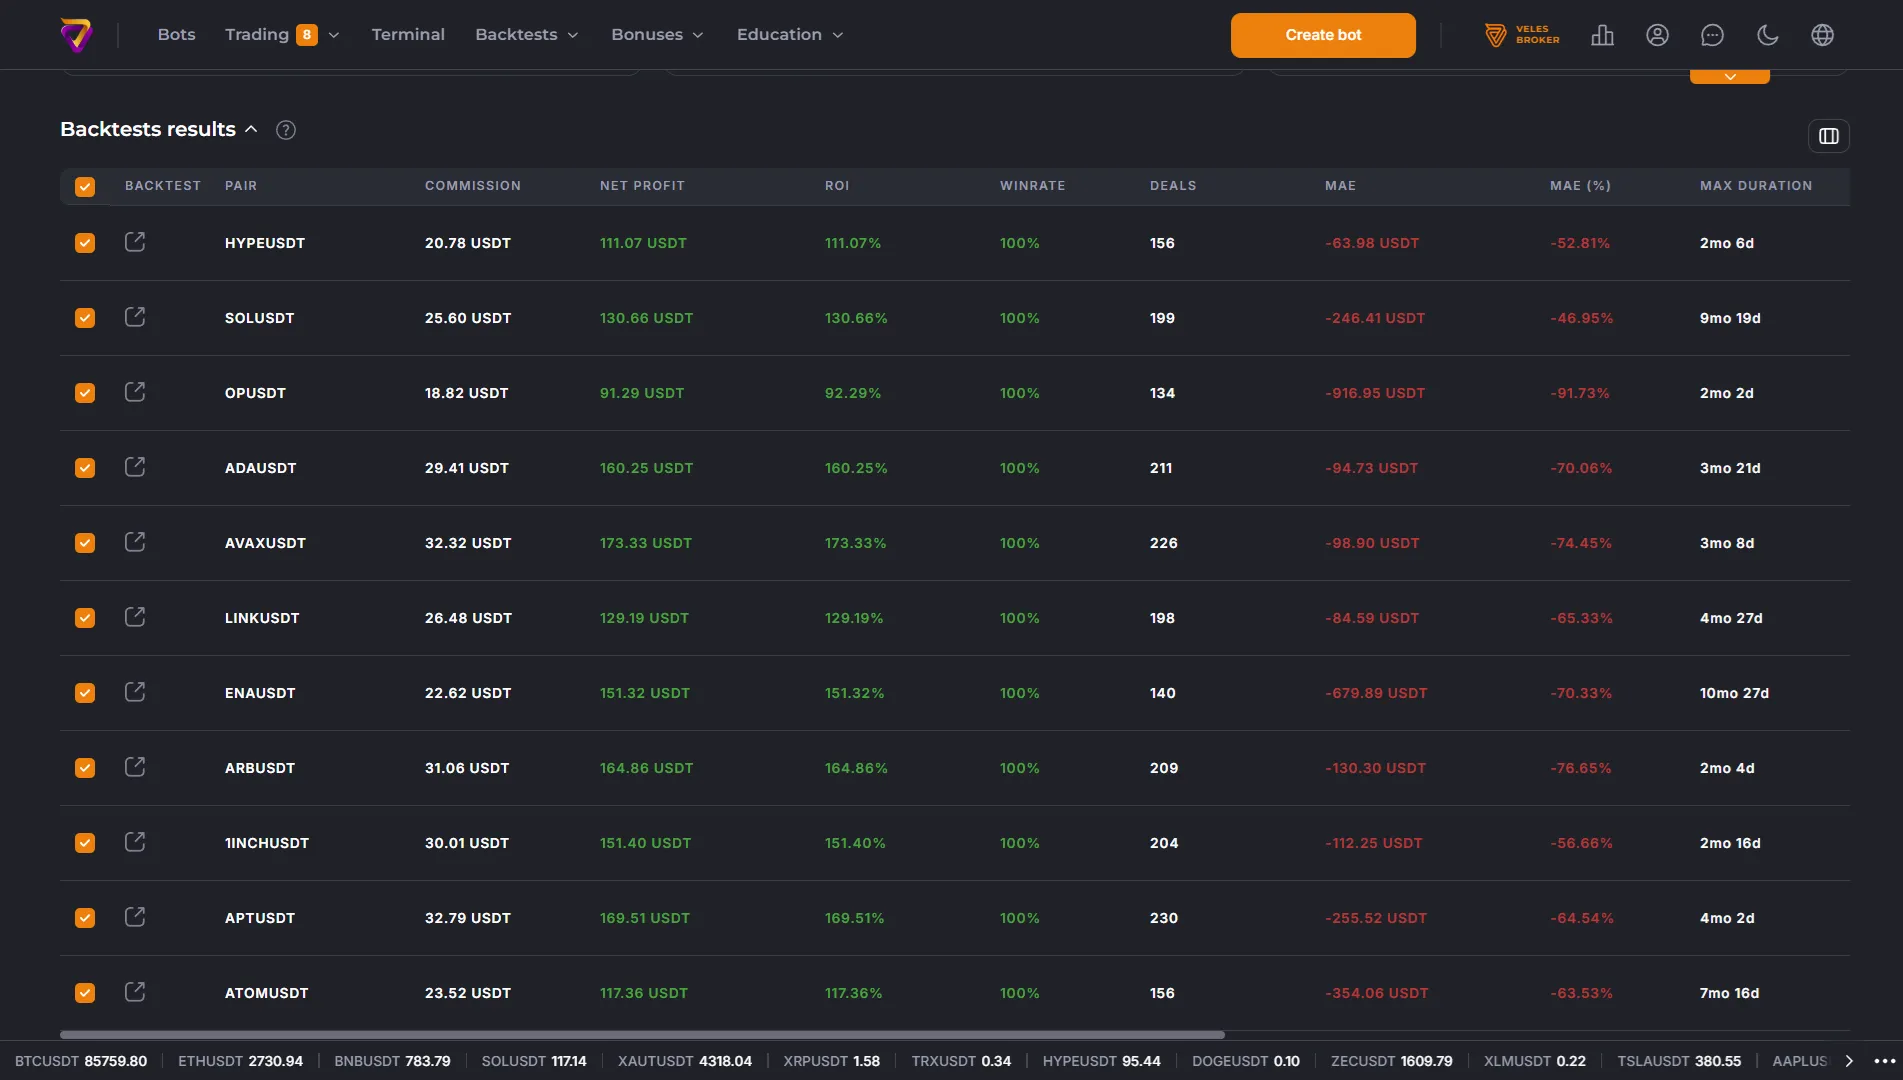
Section titled “Single-Pairs Table”The “Backtest Results” table displays backtest results for each trading pair individually. Use it to compare pairs and exclude underperforming ones from your analysis. Selecting or deselecting pairs via the checkboxes updates the summary data in real-time.
Key metrics to focus on:
- Net Profit — the final net result for the pair over the selected period.
- MAE — the maximum decline from the peak; a high drawdown indicates increased risk.
- Number of Deals — a low number of trades reduces the statistical significance of the result.
“Metrics” tab
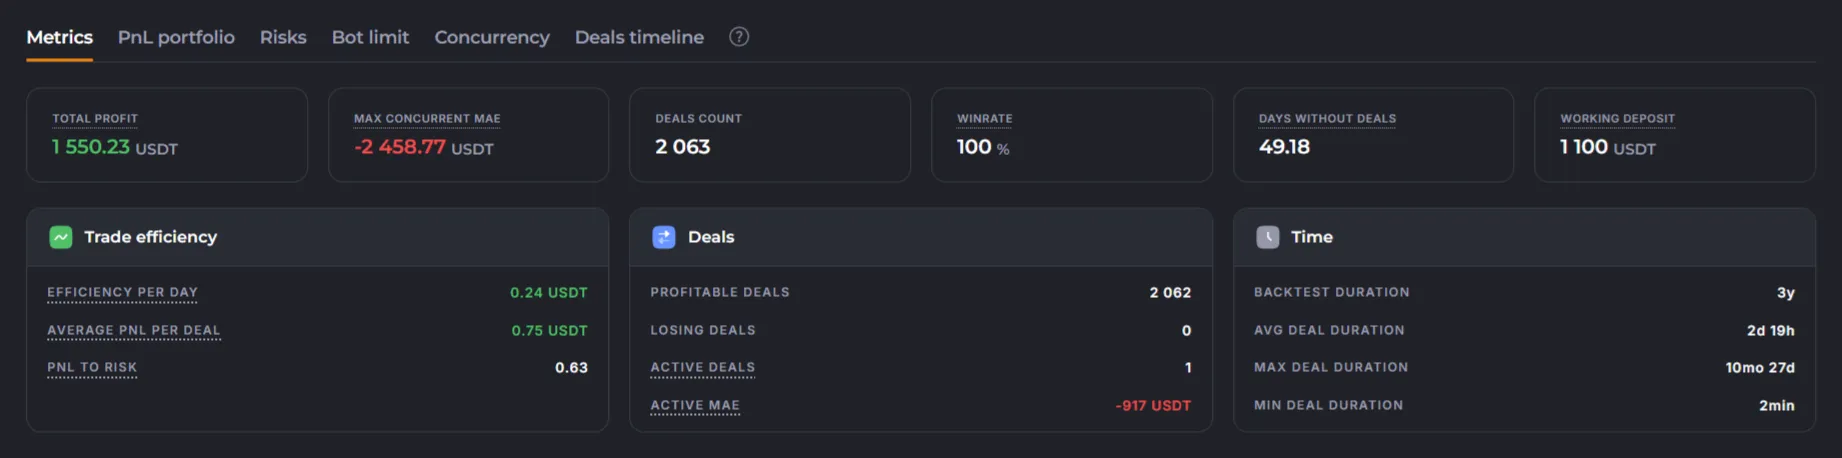
Section titled ““Metrics” tab”“Metrics” reflect the overall picture for the entire set of selected pairs. It is especially useful to watch:
- what deposit would be required for the selected number of pairs/bots;
- how many funds would be simultaneously occupied in active transactions (“Active MAE”);
- whether there were any open deals at the end of the test;
- what limit on the number of simultaneous bots/deals turned out to be the most effective;
- the maximum number of simultaneously open positions.
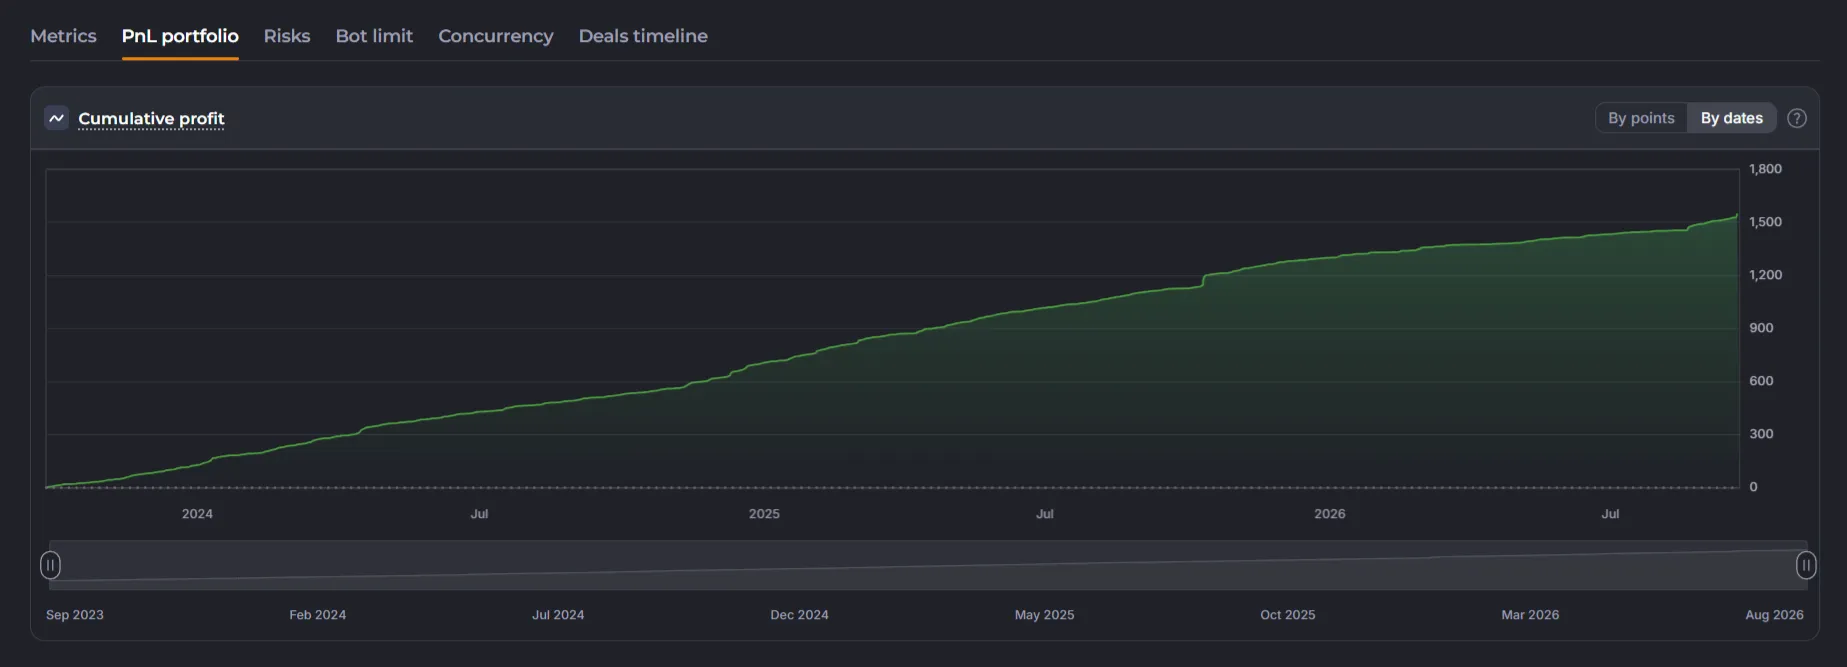
“PnL Portfolio” Tab
Section titled ““PnL Portfolio” Tab”A chart showing the strategy’s cumulative profit over time. It illustrates how the final result was generated.
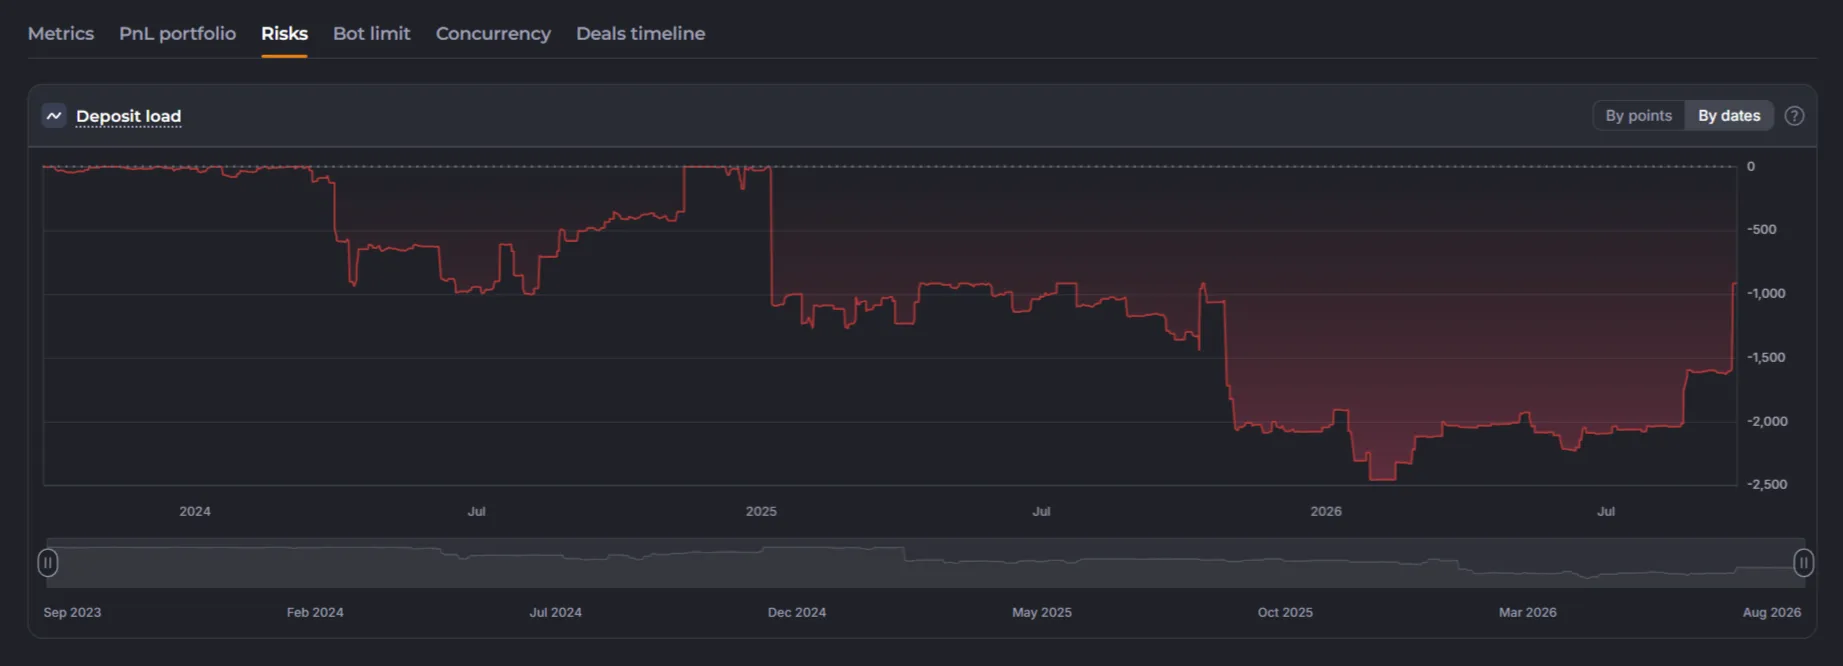
“Risks” Tab
Section titled ““Risks” Tab”A chart showing the load on the deposit over time.
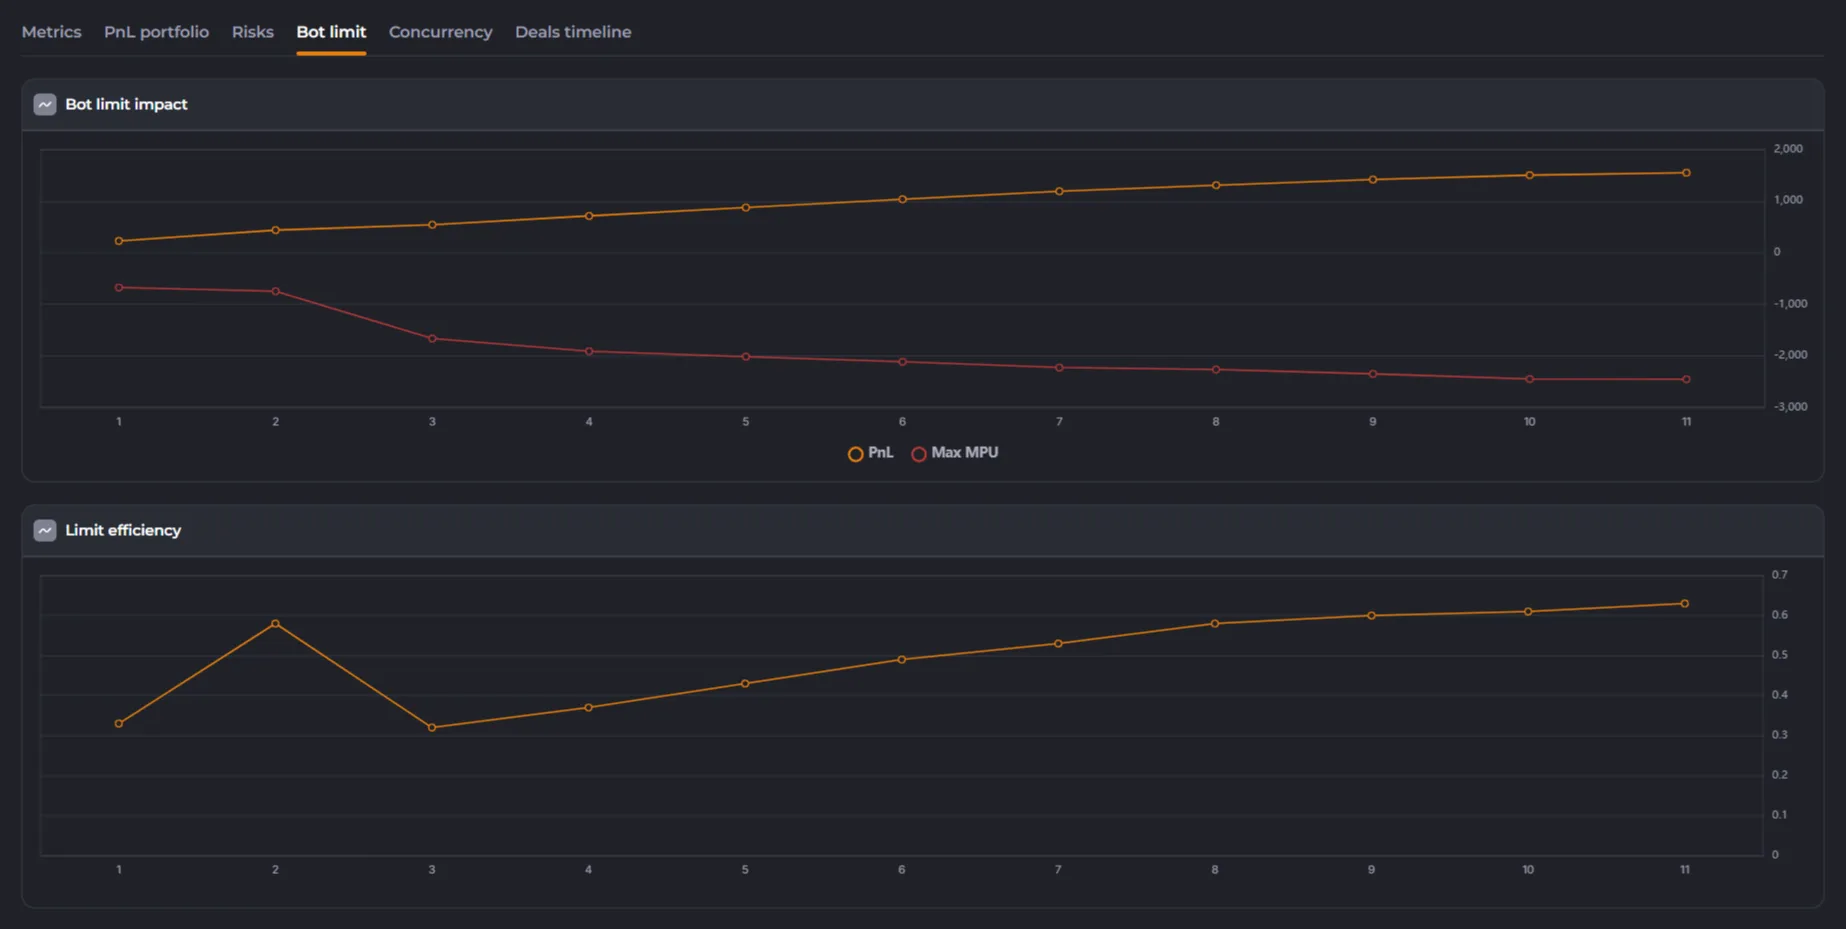
“Bot Limit” Tab
Section titled ““Bot Limit” Tab”A chart showing the impact of the number of simultaneously running bots on the total potential loss.
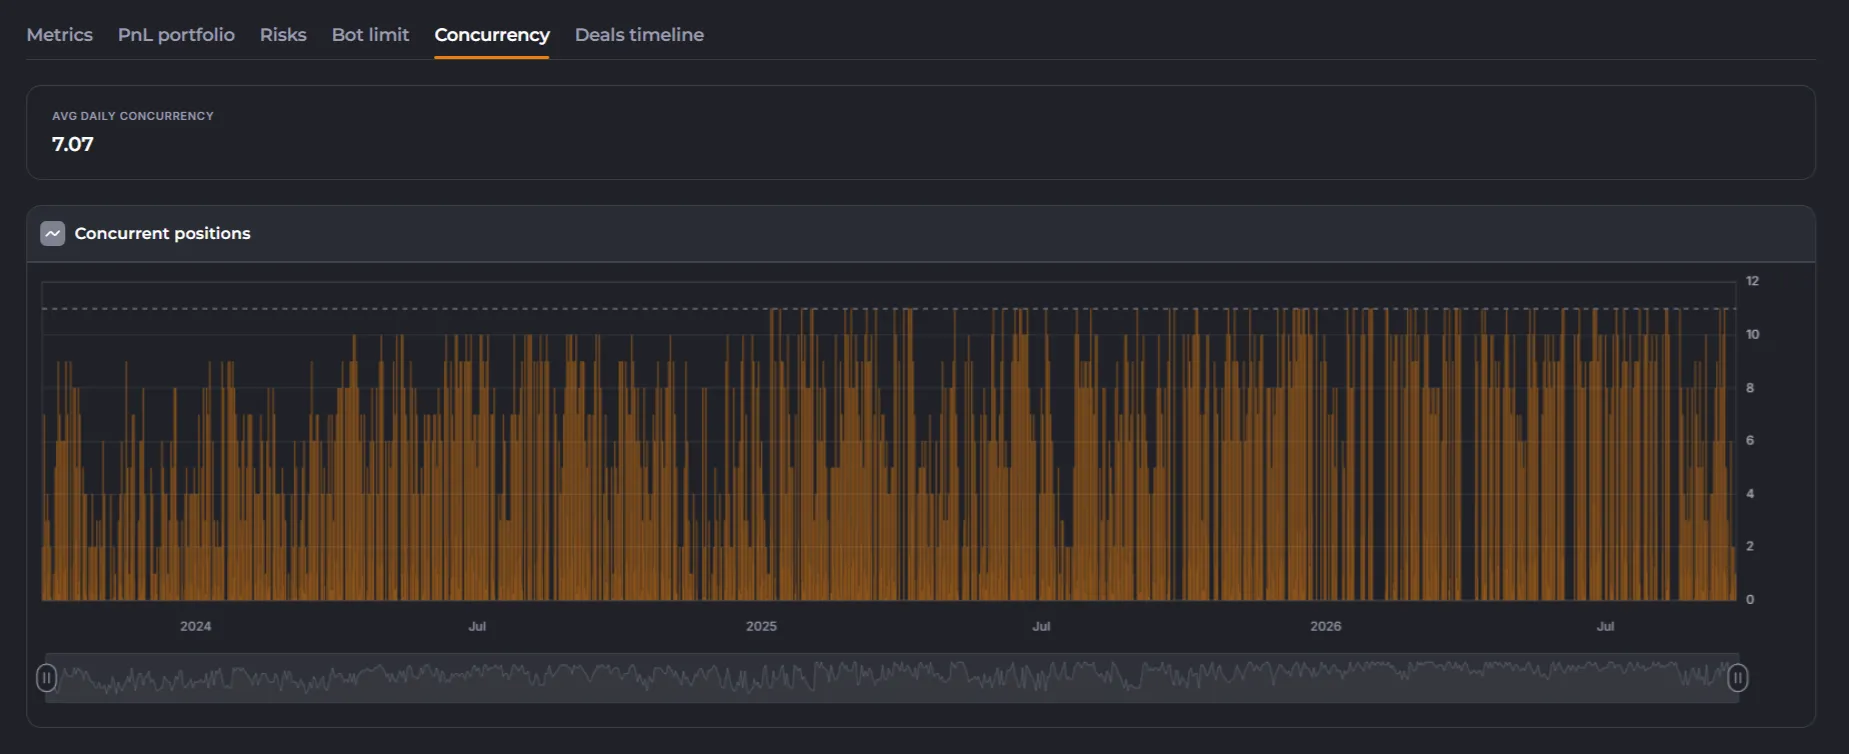
“Concurrency” Tab
Section titled ““Concurrency” Tab”A chart showing the total drawdown of active trades over time. It helps estimate the required balance buffer.
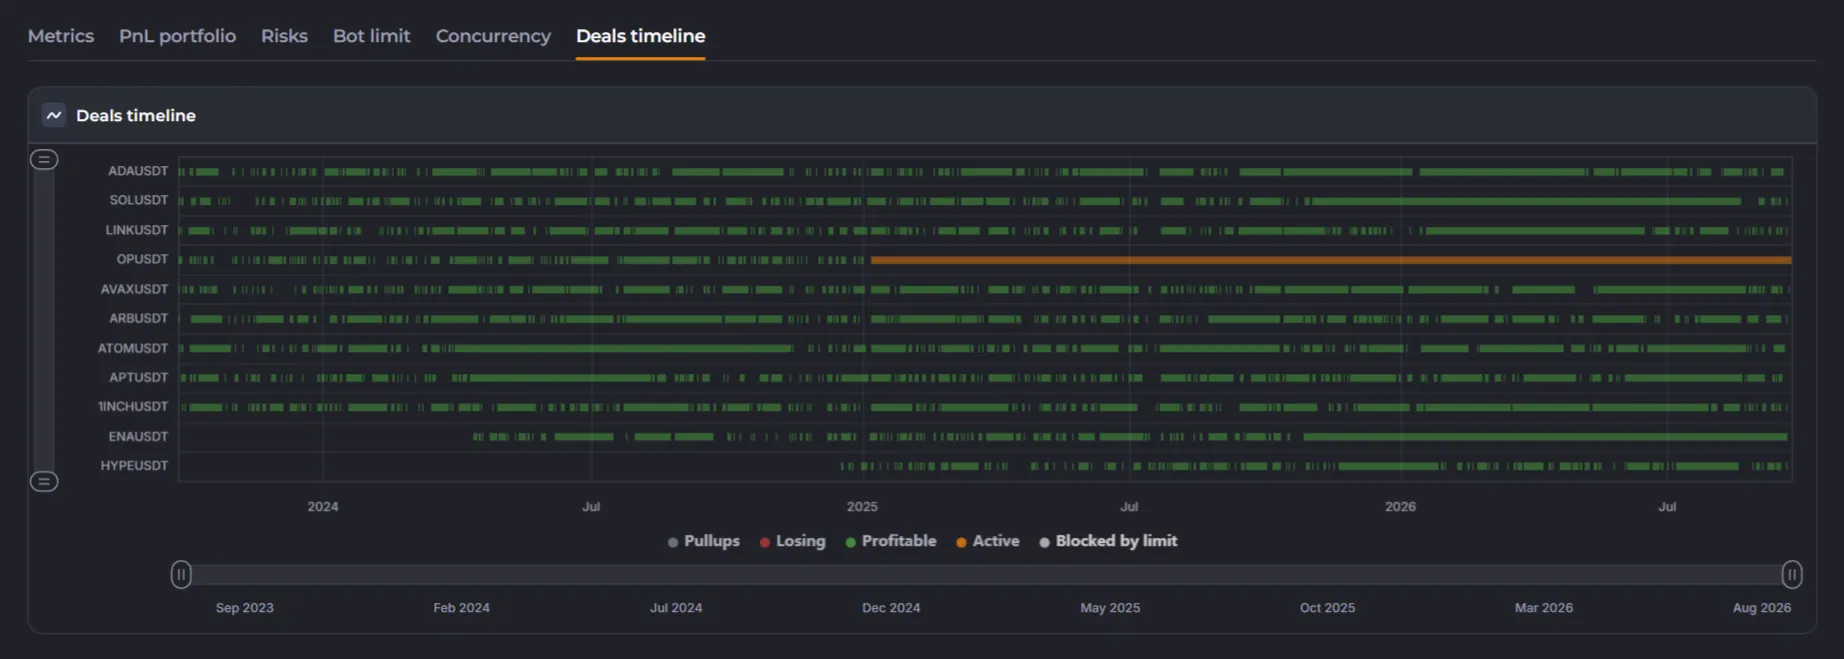
“Deals timeline” Tab
Section titled ““Deals timeline” Tab”A timeline chart of trades for each pair selected for the backtest.
Note: ideally, the chart should not show long orange bars (which indicate the status of an investment — i.e., a stalled trade).
Limitations
Section titled “Limitations”| Parameter | Details |
|---|---|
| Maximum number of deals in a block | 100 |
| Pairs lacking sufficient history | If a pair does not have enough candles for the entire selected period, it will appear in the results with a period showing no trades. |
| Minimum order check | If any pairs do not meet the minimum order requirement, a warning will be issued regarding their removal from the scan list. |
Summary
Section titled “Summary”Marketscan is particularly useful if you:
- want to select pairs for a multi-pair bot based on historical data;
- are testing a new strategy and want to see which coins it performs best with;
- are assessing the load on your deposit before launching multiple bots simultaneously;
- are determining the optimal block limit for your strategy.